Training Seminar 11 - Urban Water Cycle Green Field Development
Instructions
The Truganina precinct has been adopted as part of the focus area for a recent Scenario Tool case study. The purpose of this case study is to consider how specific interventions of urban form and water servicing in greenfield development areas can support the delivery of integrated water management outcomes. The rapid transformation of Melbourne’s west is impacting on the water cycle of this region, and there is keen interest amongst government stakeholders to investigate how strategic changes to urban planning and development may help to resolve challenges the regional water balance is facing due to population growth and climate change.
The Truganina PSP describes the vision for Truganina and ensures the delivery of key local infrastructure to promote accessibility and community activity within the precinct. In this tutorial, we will use part of the Truganina PSP with the Scenario Tool to model the Water Cycle Model for the specified area of mixed land uses and quantify the potential reduction in water sourced from the water supply system as a result of the implementation of various alternative water sources. In total, four scenarios will be produced: the baseline conditions detailing the current state of pre-developed Truganina, a business-as-usual case reflecting the proposed development of Truganina owing to existing planning policies and schemes, and three intervention scenarios that each feature different alternative water source systems.
Truganina - Urban Water Cycle
Model Setup
Before beginning, use this Dropbox folder to access the GIS data employed as part of this seminar
To start, navigate to the Scenario Tool website and log in using your registration details (otherwise register for the tool and then proceed to log in)
At the project dashboard, create a new project, name it, and set the region to Melbourne
Select the land surface temperature and water balance modules
Upload the boundary file that is part of the GIS dataset previously referred to
Submit the project to initialisation it
Upload the remaining GIS files after reaching the project dashboard
Scenario 1 - BAU
This scenario represents the business-as-usual approach, incorporating a mix of different land uses and serving as the case that will be subjected to the implementation of alternative water source schemes.
Note
The nodes, their parameters and the GIS layers used with them have been informed from a combination of relevant literature and government authority input. As part of this seminar, the specific documentation for each node should be read to gain an understanding of its function and the resources used to calibrate it.
To prepare the business-as-usual scenario, begin with the ‘Clear Area’ node and add ‘Residential’ node, using the ‘residential.geojson’ file as the area of effect and the parameter set below; then, follow the relevant table to set up the rest of the scenario. Fig. 2 shows the outputs for the urban from and land surface temperature across the case study area
Parameter |
Residential |
Light Industrial Zone |
Educational Zone |
|---|---|---|---|
Workflow Node |
Urban Form |
Urban Form |
Urban Form |
Area |
Residential |
Industrial |
School |
City block width |
80 |
180 |
10000 |
City block length |
240 |
120 |
10000 |
Street offset |
8 |
5.25 |
0.1 |
Parcel width |
14 |
54.75 |
10000 |
Parcel length |
31 |
42.8 |
10000 |
Building height |
6 |
7.5 |
7.5 |
Site coverage |
0.6 |
0.45 |
0.2 |
Residential units |
1 |
2 |
680 |
Hardstand fraction |
0.5 |
0.82 |
0.63 |
Garden fraction |
0.8 |
0.8 |
1.0 |
Tree canopy diameter |
7 |
7 |
7 |
Percentage of lots with trees |
0 |
0 |
0 |
Number of trees per lot |
0 |
0 |
0 |
Street tree spacing |
13 |
13 |
13 |
Workflow Node |
Create Lot |
Create Lot |
Create Lot |
Area |
Recreational Reserve |
Road |
Other Pervious Area |
Employee/student count |
0 |
0 |
0 |
Tree Cover |
0 |
0 |
0 |
Water Cover |
0 |
0 |
0 |
Grass Cover |
0 |
0.25 |
0.9 |
Irrigated Grass Cover |
1.0 |
0 |
0 |
Roof Cover |
0 |
0 |
0 |
Road Cover |
0 |
0.5 |
0 |
Concrete Cover |
0 |
0.25 |
0.1 |
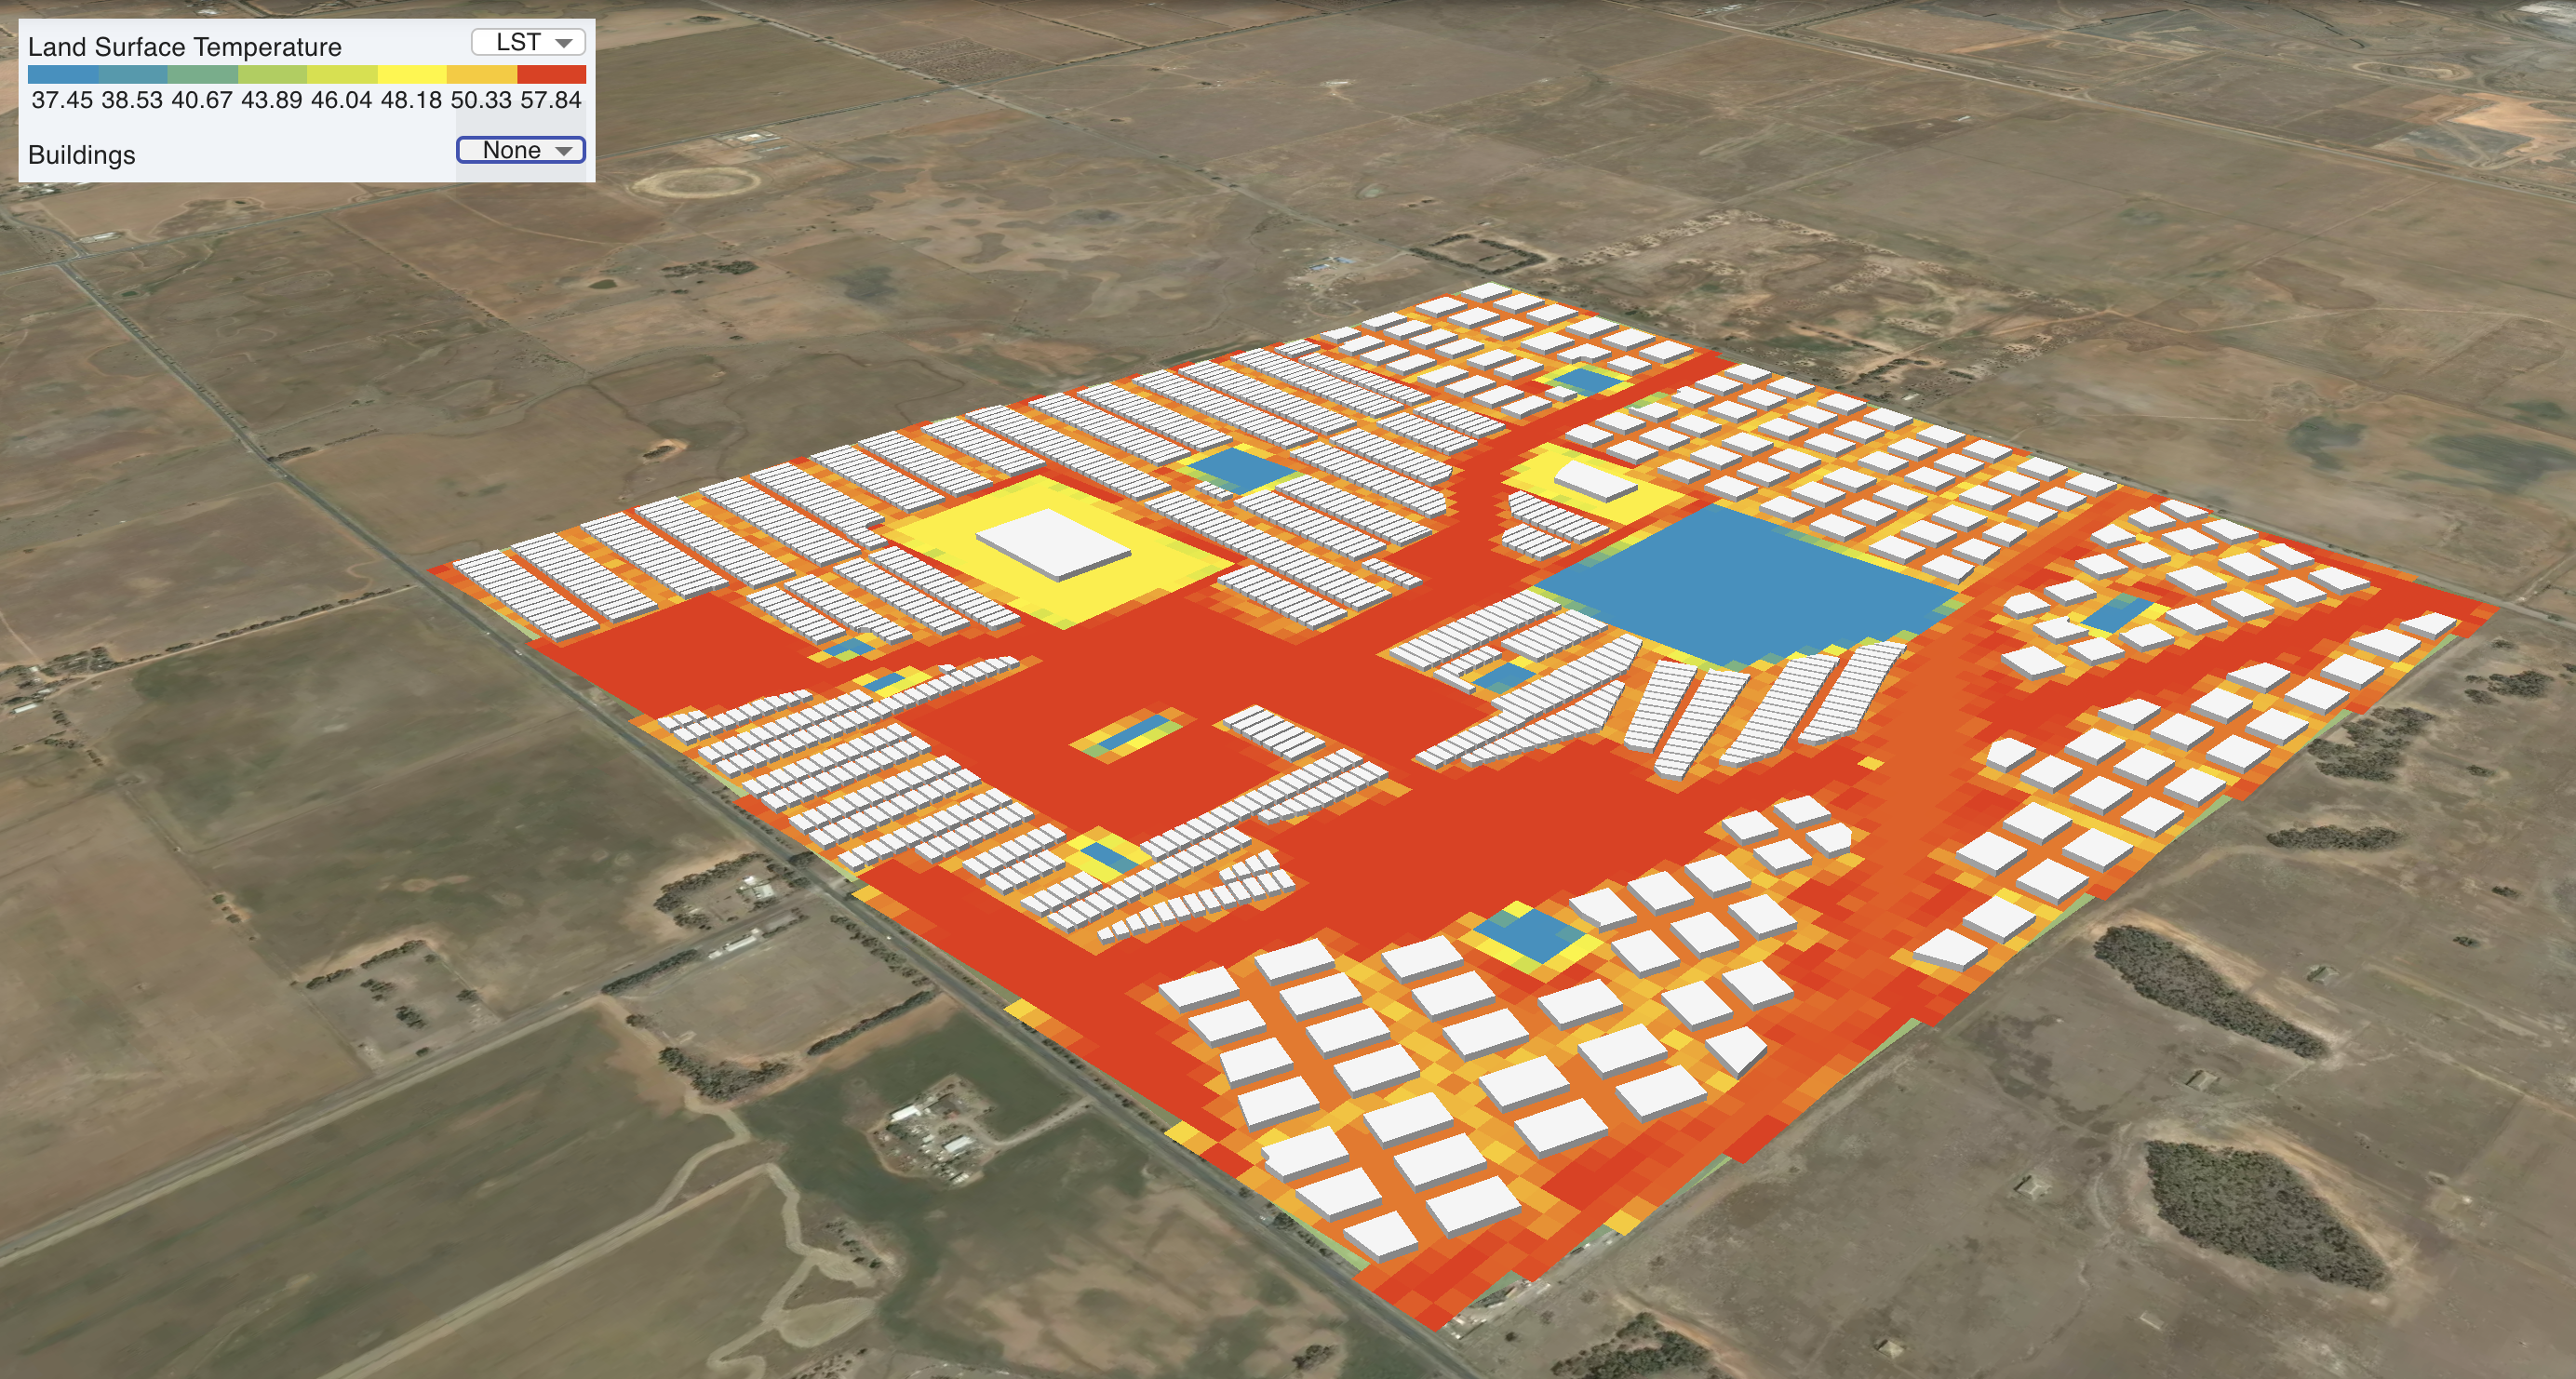
Fig. 3 Urban form and Land Surface Temperature for the BAU scenario
Scenario 2 - RWHT
The first intervention scenario centres on rainwater harvesting, with residential lots now gaining access to rainwater for non-potable and out door reuse. Therefore, the residential properties need to be assigned a new lot template.
Parent scenario: BAU
- Workflow node: Lot Template
Area: Residential
All other values are default
- Workflow node: Lot Scale Storage
Area: Residential
Inflow: roof runoff
Demand Priority 1: non potable demand
Demand Priority 2: outdoor demand
Demand Priority 3: -
Storage Volume (m3): 5
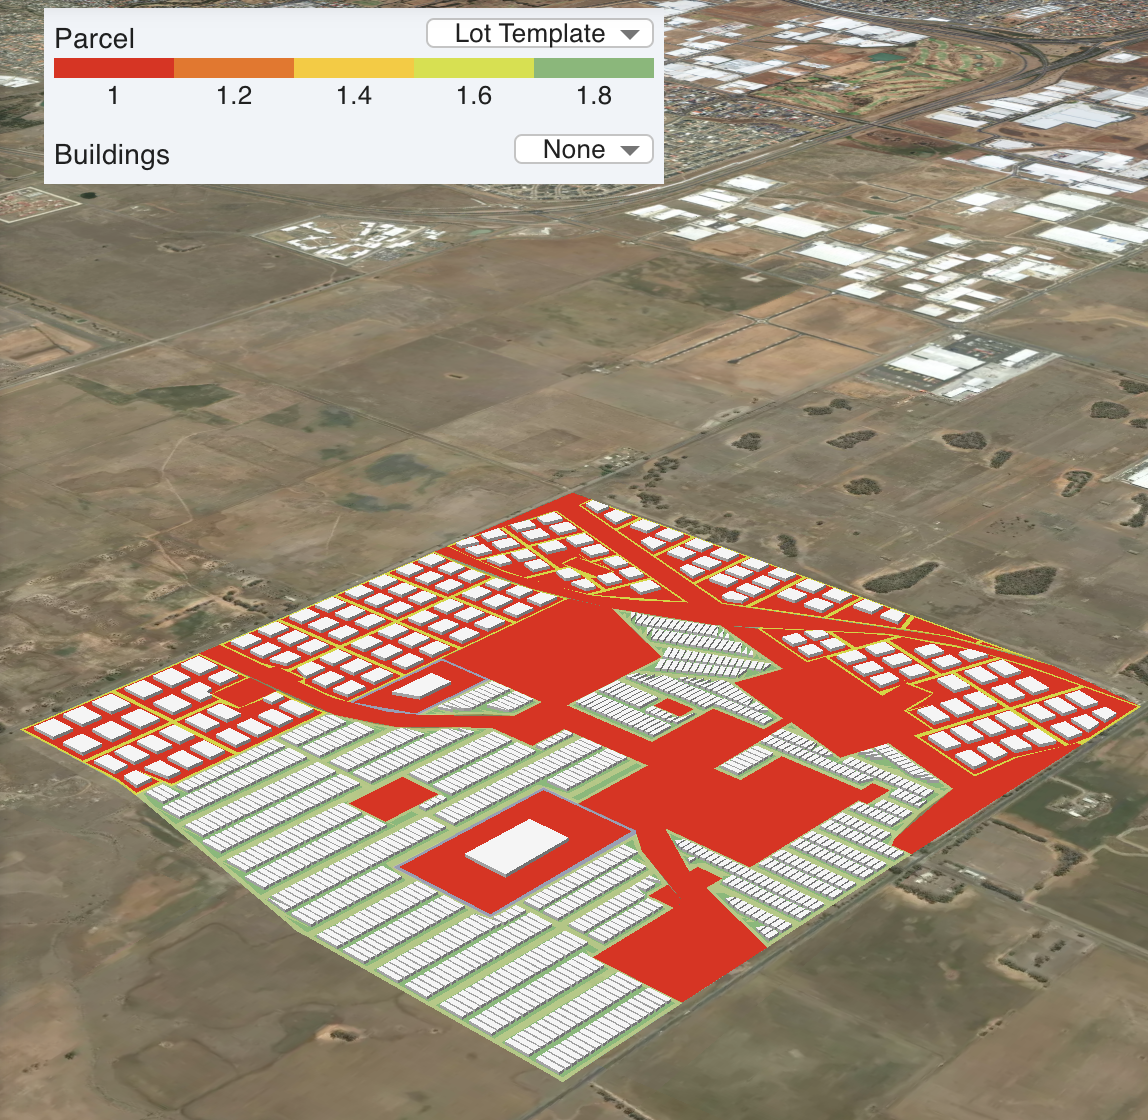
Fig. 4 Lot template IDs in the catchment.
Scenario 3 - Water Recycling
The first intervention scenario centres on a water recycling system, which collects wastewater from the entirety of the case study’s population and supplies it as reclaimed water to all industrial lots. To do so 2 sub catchments are added to the model. The first sub catchment will collect waste water from the residential area and the 2nd will define the industrial zone as reclaimed water zone.
Parent scenario: BAU
- Workflow node: Sub Catchment
Area: Residential
Stream: sewerage
- Workflow node: Sub Catchment
Area: Industrial
Stream: potable demand
- Workflow node:Sub Catchment Storage
Area: Case study area
Inflow: Residential
Stream: sewerage
Demand Priority 1: Industrial
Stream: potable demand
Storage Volume: 500
Scenario 4 - Water Recycling + RWHT
The second intervention builds off the first, with residential lots now gaining access to rainwater for non-potable reuse.
Parent scenario: Water Recycling
- Workflow node: Lot Template
Area: Residential
All other values are default
- Workflow node: Lot Scale Storage
Area: Residential
Inflow: roof runoff
Demand Priority 1: non potable demand**
Demand Priority 2: outdoor demand**
Demand Priority 3: -
Storage Volume (m3): 5
Results
You should have access to tiles depicting: lot scale in and outflows; water being recycled within the project area’s water supply system at a lot and sub catchment scale; and the overall water balance of the catchment. The bar graphs comprising the tiles will allow you to witness how the different scenarios compare in terms of the various elements of the urban water cycle.
Lot scale
The lot scale outputs are shown below.:numref:lot_scale_inflow shows total inflow of water for all lots and Fig. 20 shows the total outflow. Note that the rainfall has been disabled in Fig. 19. The volumes reported in the user interface are the total flow after a lot scale storage. This means, for the RWHT scenario the total inflow and outflow will be reduced. Note, that the residual volume in the storage tank at the end of the simulation might cause a slight discrepancy when comparing the total inflow to the total outflow.
The graphs show that the with installation of RWHT an estimated 43k m3 can be saved and the storm water runoff reduced by 8%, reducing the outdoor demand by 30% and non potable demand by 20%
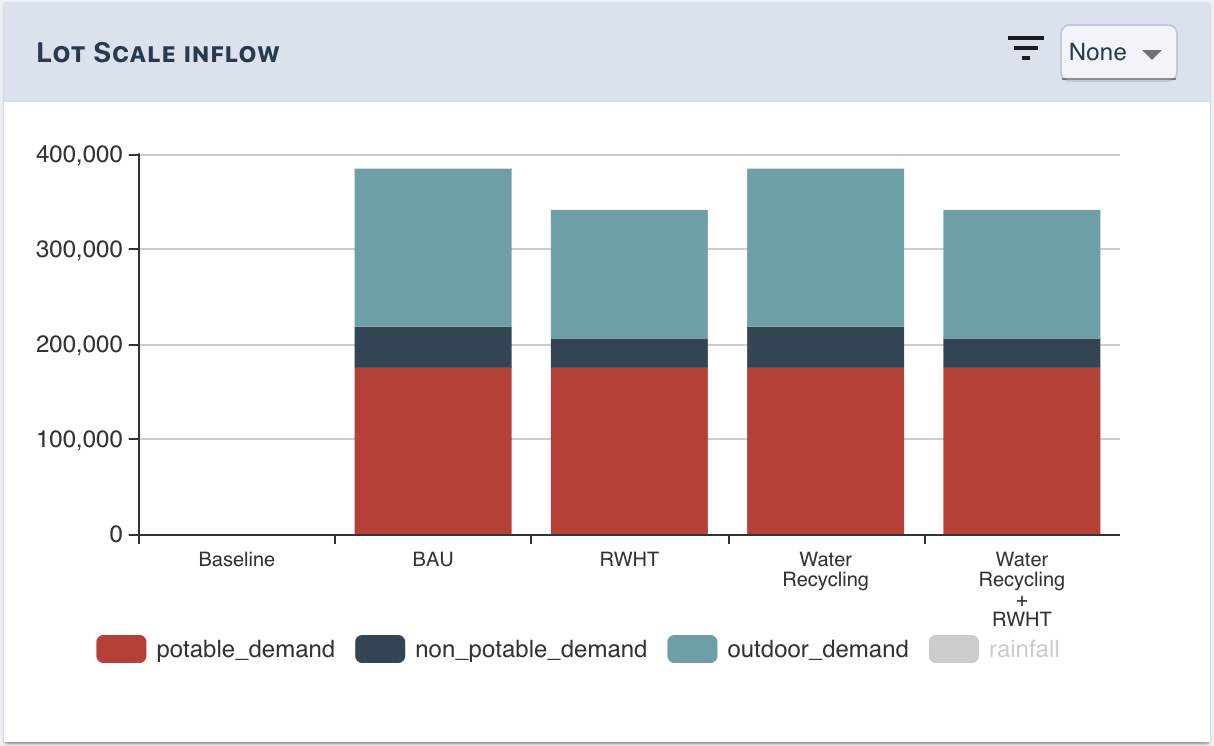
Fig. 5 Lot scale inflow
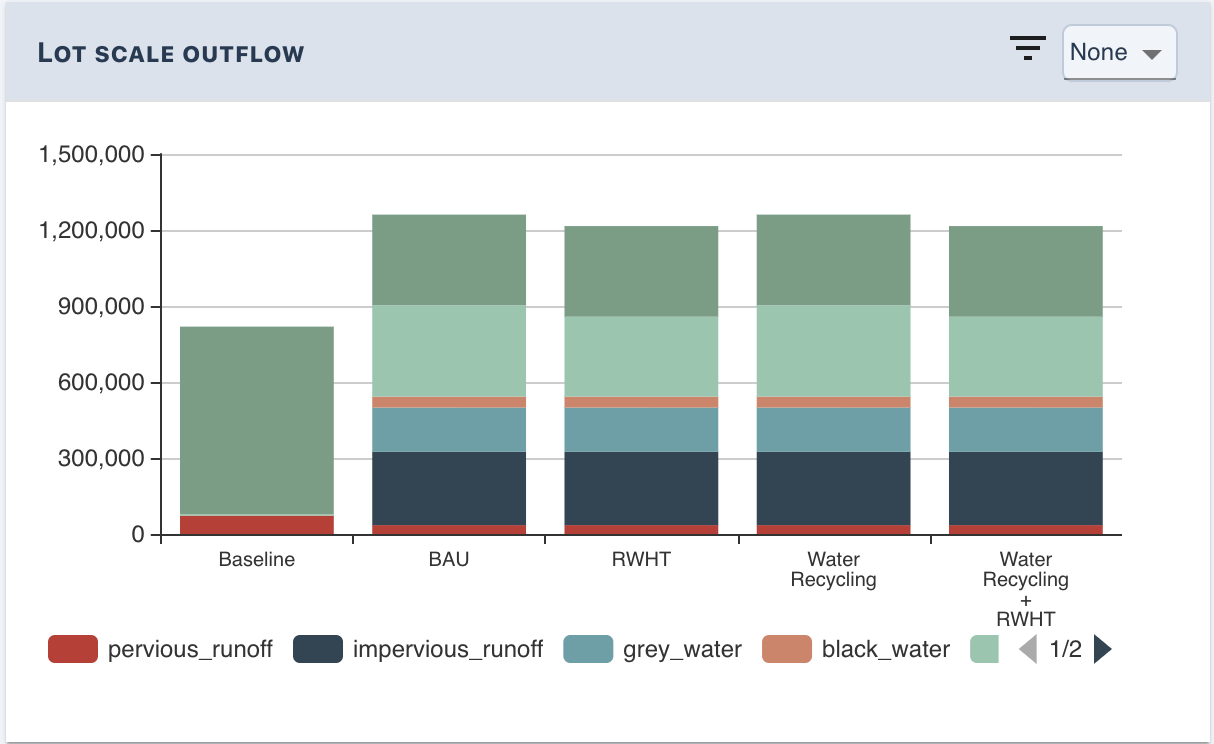
Fig. 6 Lot scale out flow
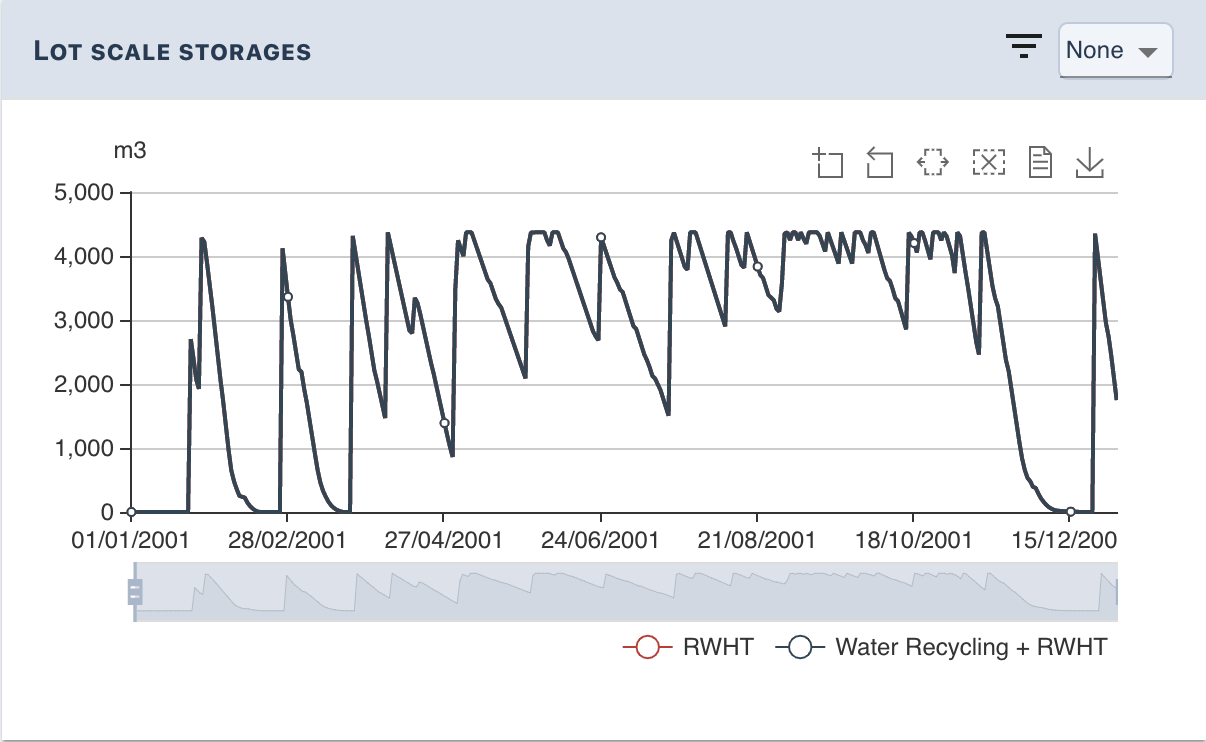
Fig. 7 Lot scale storage
Sub catchment scale
The sub catchment results are shown below.:numref:sub_catchment_inflow shows the total inflow of water for all sub catchments and Fig. 24 shows the total outflow. Note that the rainfall has been disabled in Fig. 24. The volumes reported in the user interface are the total flow after a sub catchment scale storage. This means, if as shown in the figures a water recycling system is installed, the total inflow and outflow will be reduced. Note, that the residual volume in the storage tank at the end of the simulation might cause a slight discrepancy when comparing the total inflow to the total outflow.
The graphs show that the with implementation of a waste water recycling scheme an estimated 50k m3 can be saved, reducing sewerage by 23% and the potable demand by 13%.
The combined effect of the RWHT and waste water recycling can reduce the required imported water (potable, non potable and outdoor) by 90k m3 or in total 24%.
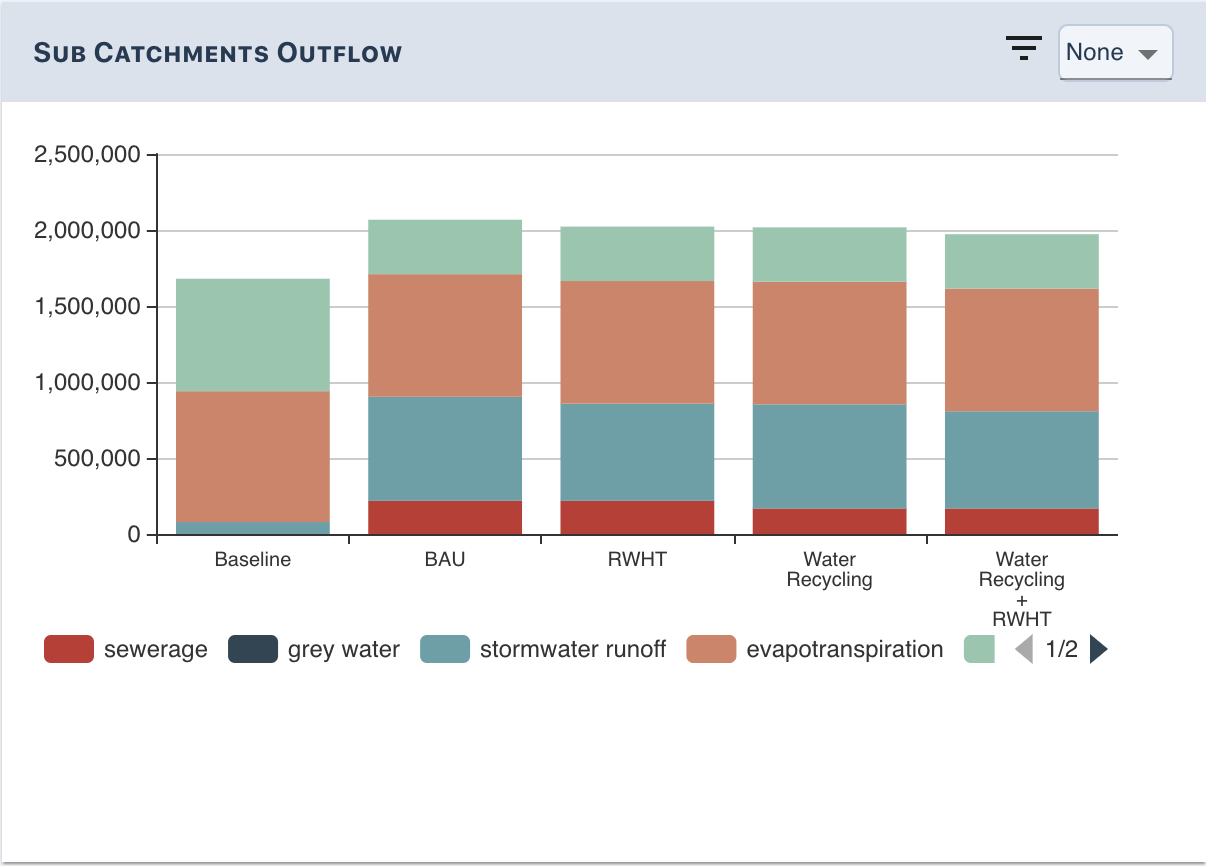
Fig. 8 Sub catchment inflow
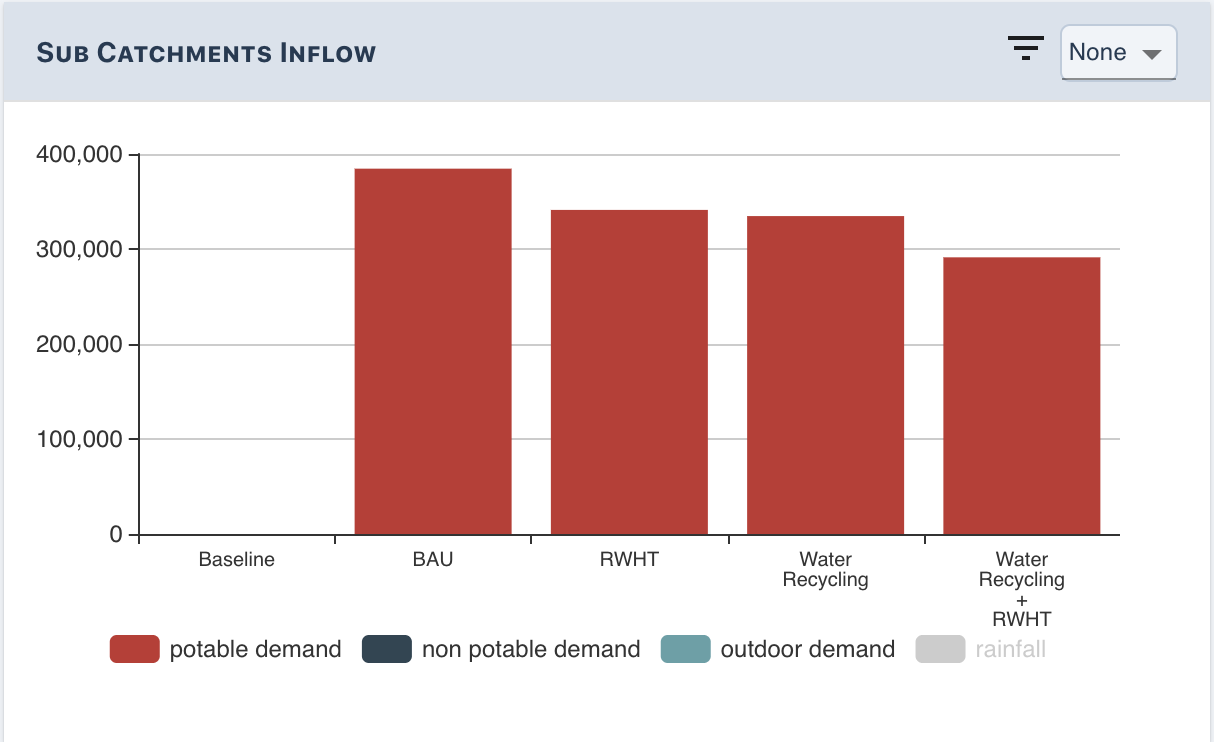
Fig. 9 Sub catchment outflow