Training Seminar 13 - Climate Change
Instructions
As part of its functionality, the Scenario Tool models the performance of different climate change scenarios through the lens of the urban water cycle and urban heat island effect.
High resolution climate data become more and more ready available in Australia. See for example the climate dashboard for Queensland https://longpaddock.qld.gov.au/qld-future-climate/understand-data/. In this seminar we will demonstrate how these data can be used in the scenario tool to explore their impact for case studies in Brisbane and Townsville.

The tutorial will use the land surface, TARGET, water balance model and climate change nodes to:
Assess the current urban water balance and heat island effect for a greenfield development
Assess the impacts of different climate change scenarios
Note: None of the data or modelling specifications included within this training exercise are reflective of any real-world initiatives by government authority or any other organisation.
Preparation
Before beginning, use the link to this Dropbox folder to access the GIS files and models employed as part of this case study and download them to your computer.
To start, navigate to https://www.wsc-scenario.org.au/ and click on ‘Register’ if you haven’t done so yet (note: you’ll have to re-register for the tool here if you had previously registered for an older iteration of the tool).
Log in using your registration details. You will be taken to the project dashboard – hit the plus button to bring up the new project setup window.
Note: If you have registered for the seminar you will find the example in your projects #13 Greenfield
Greenfield Case Study
Model Setup
Create a new project and select the Townsville Region
Select a simple data model
- Select the assessment models in following order
Land Surface Temperature
TARGET
Water Cycle Model
Upload boundary provided in the data pack
Confirm and submit the simulation.
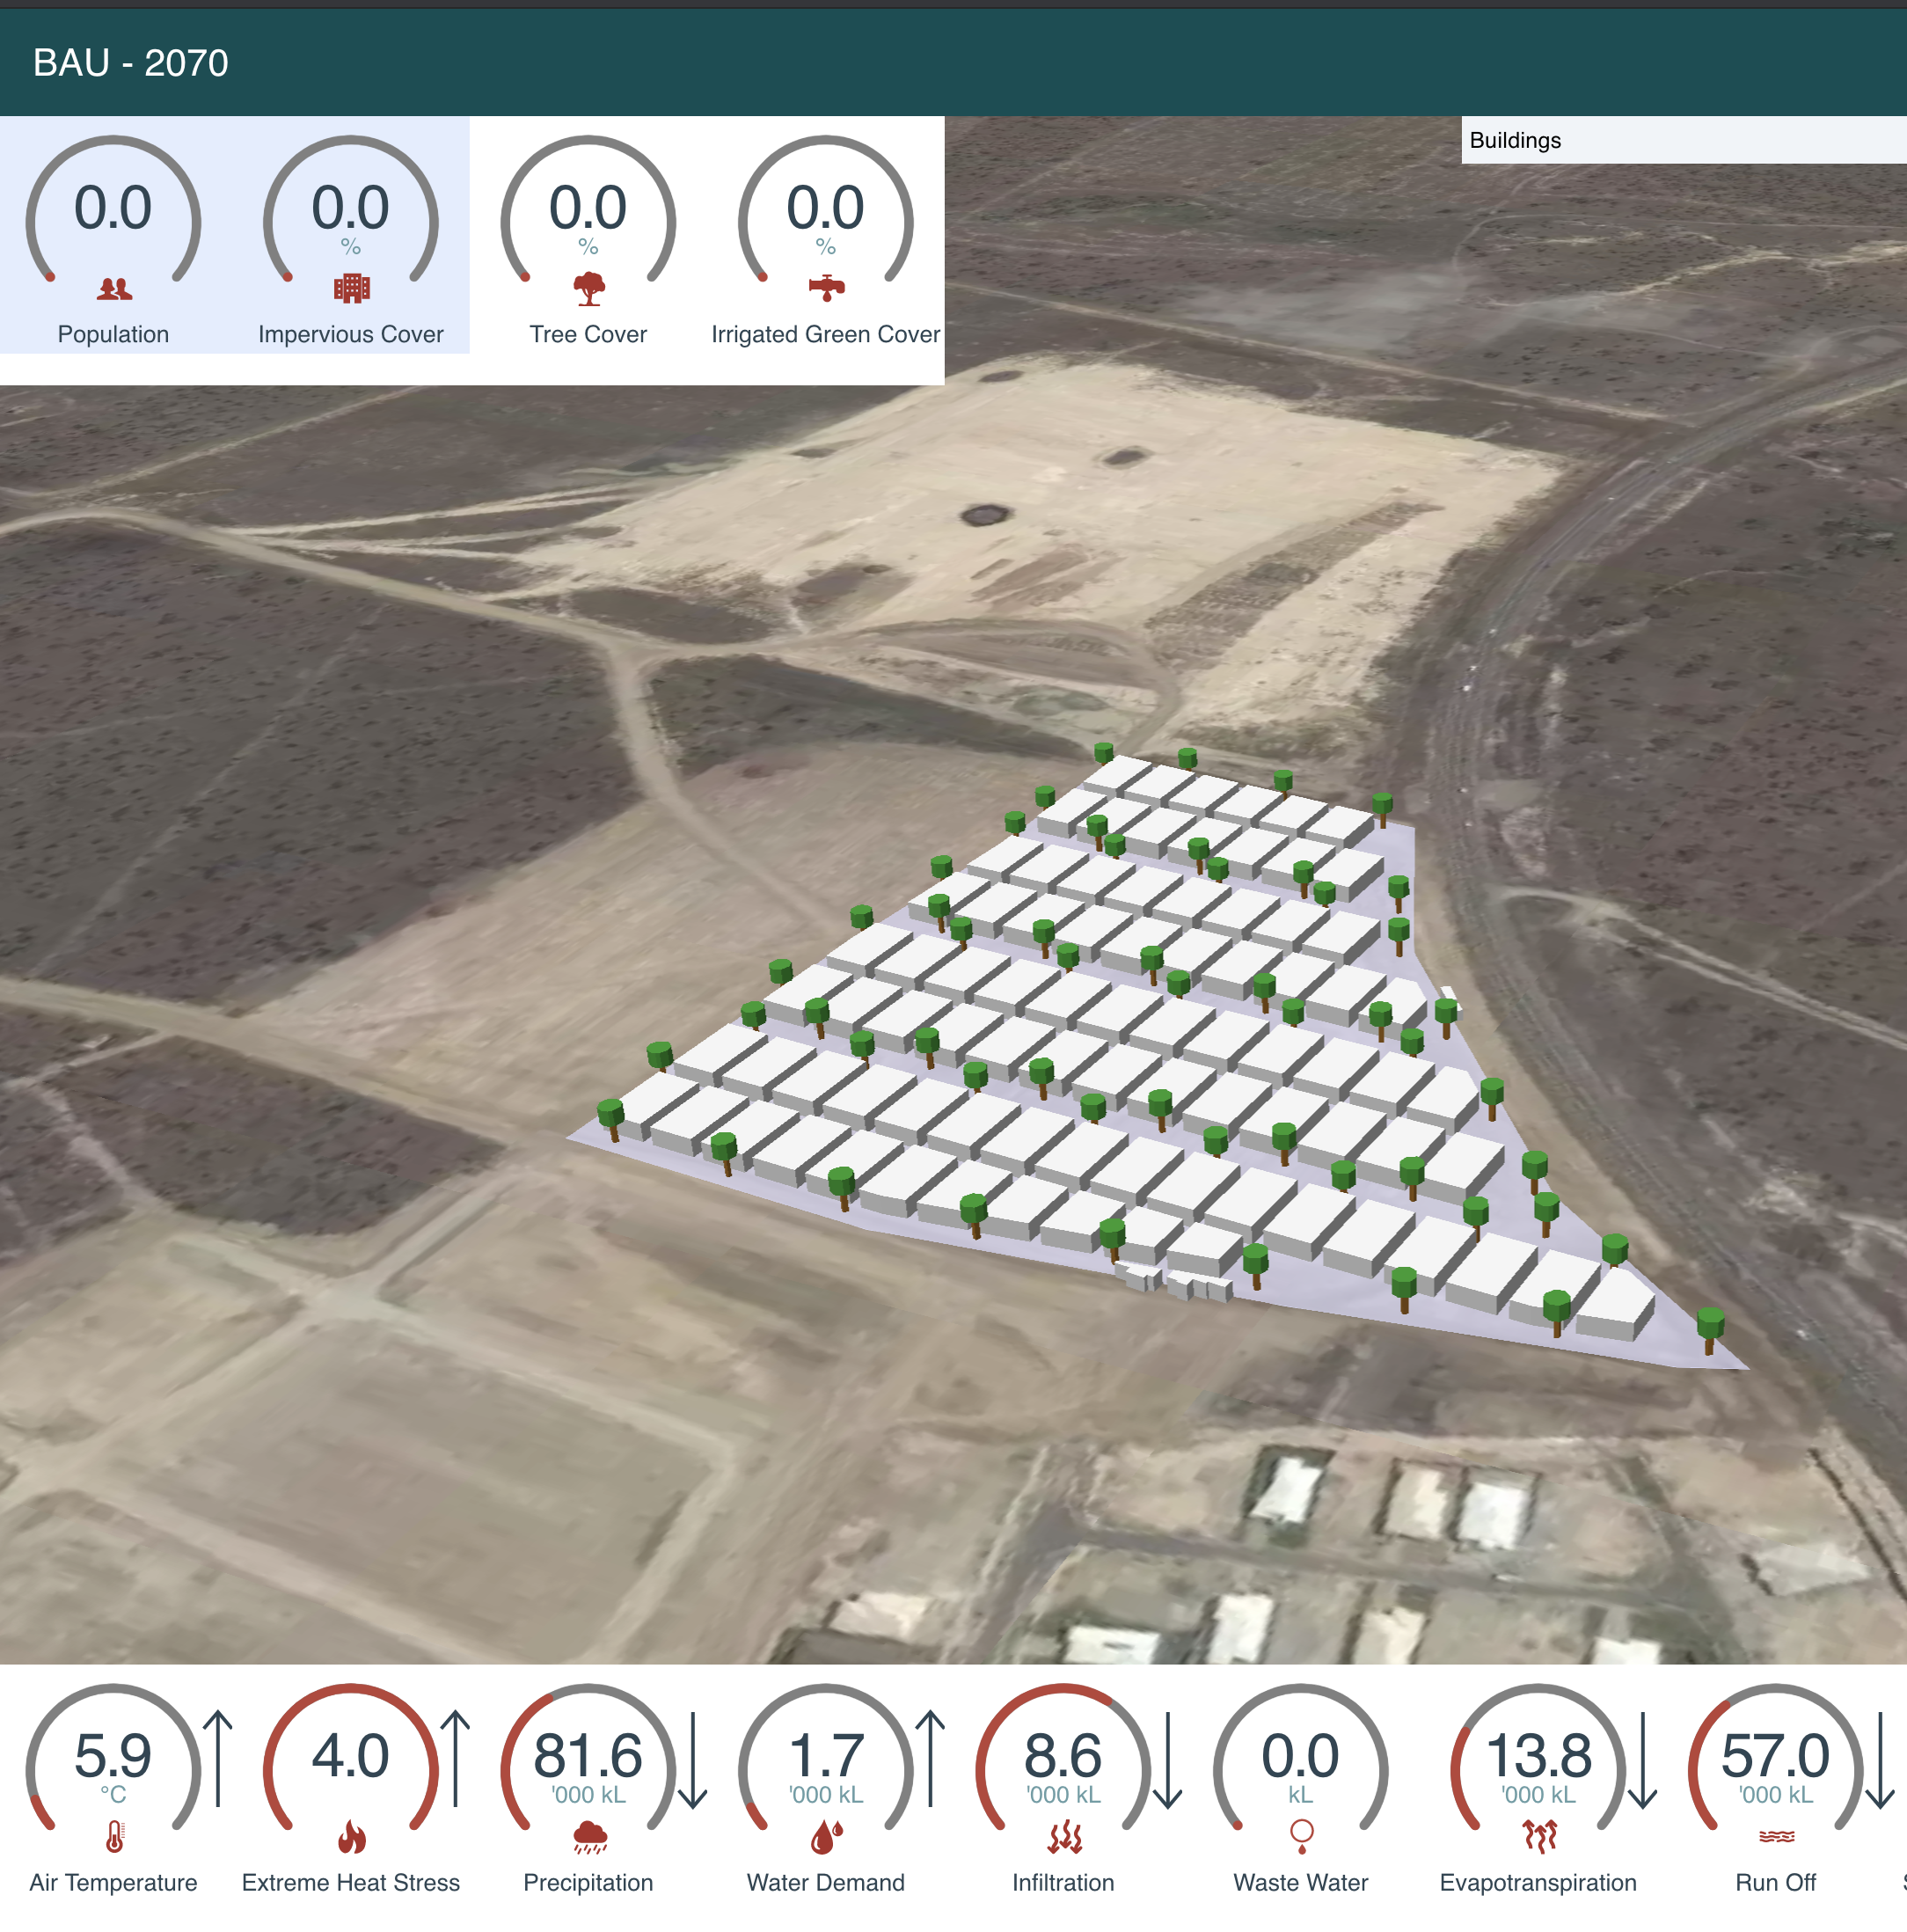
This scenario represents the business-as-usual approach, incorporating medium density residential development.
Note
The nodes, their parameters and the GIS layers used with them have been informed from a combination of relevant literature and government authority input. As part of this seminar, the specific documentation for each node should be read to gain an understanding of its function and the resources used to calibrate it.
BAU
To prepare the business-as-usual (BAU) scenario use the nodes and parameter sets listed below;
Parent scenario: Baseline
- Workflow node: Urban Form
Area: Case study area
- City blocks:
width: 50
depth: 200
- Street Offset:
offset: 5
- City Parcels:
width: 17.5
depth: 17.5
- Building:
site coverage: 0.65
hardstand fraction: 0.3
- Trees:
number of trees per lot: 0
street tree spacing: 40
- Workflow node: Reduce Landcover Fraction
Area: Case study area
Land Cover Change: 0.22
Landcover reduction: road
Landcover increase: irrigated grass
- Workflow node: Reduce Landcover Fraction
Area: Case study area
Land Cover Change: 0.35
Landcover reduction: road
Landcover increase: grass
RWHT
Setup a new scenario derived from BAU and assign a RWHT tank to all buildings
Parent scenario: BAU
- Workflow node: Lot Scale Storage
Area: Case Study
Inflow: roof runoff
Demand Priority 1: non potable demand
Demand Priority 2: outdoor demand
Demand Priority 3: -
Storage Volume (m3): 5
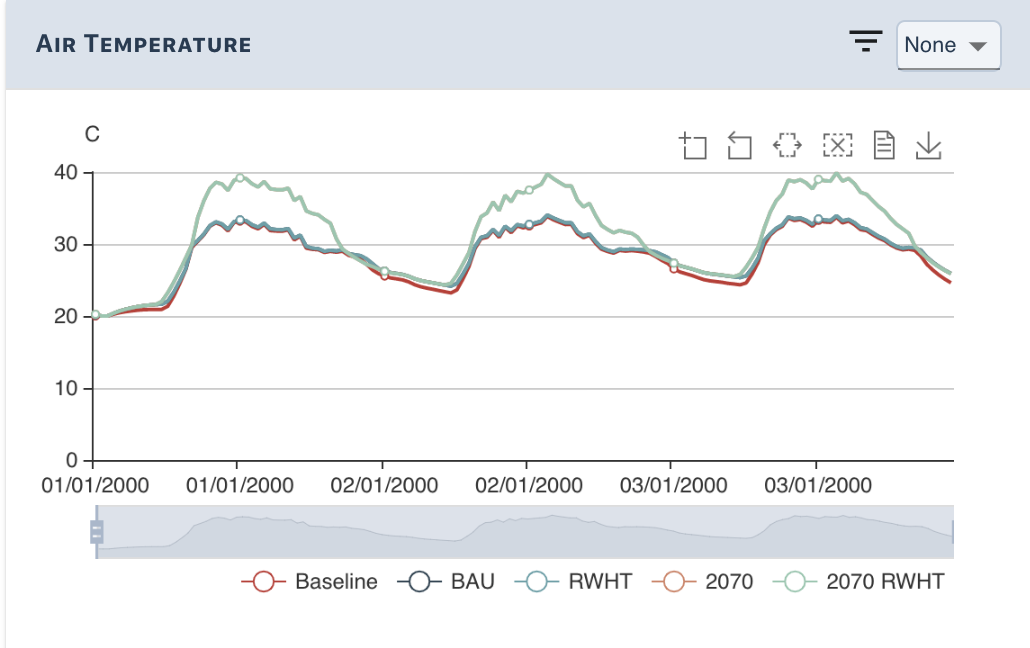
Climate Change 2060
The climate change scenarios are generated using the Climate Change Target node and the Climate Change Urban Water Cycle node. Both nodes link directly to the 11 downscaled climate scenarios for Queensland. Depending on the user defined climate change model and the period the nodes will perform a statistical analysis of the 24h temperature and rainfall data. The Exceedance Fraction parameter defines a exceedance probability of the generated input data. Which means for TARGET an exceedance probability of 0 will select the hottest 3 day period, a probability of 0.2 means that 20% of the days in the selected period will be hotter than the selected time series. For the Urban Water Cycle an exceedance probability of 0 defines the wettest year whereas 0.99 defines the driest.
For this scenario we choose a period from 2050 - 2070 and select the hottest 3 day period and an average annual rainfall.
Parent scenario: BAU or RWHT
- Workflow node: Climate Change TARGET
Area: Case Study
Start Period: 2050
End Period: 2070
All other values are default
- Workflow node: Climate Change Urban Water Cycle
Area: Case Study
Start Period: 2050
End Period: 2070
Exceedance Fraction: 0.5
All other values are default
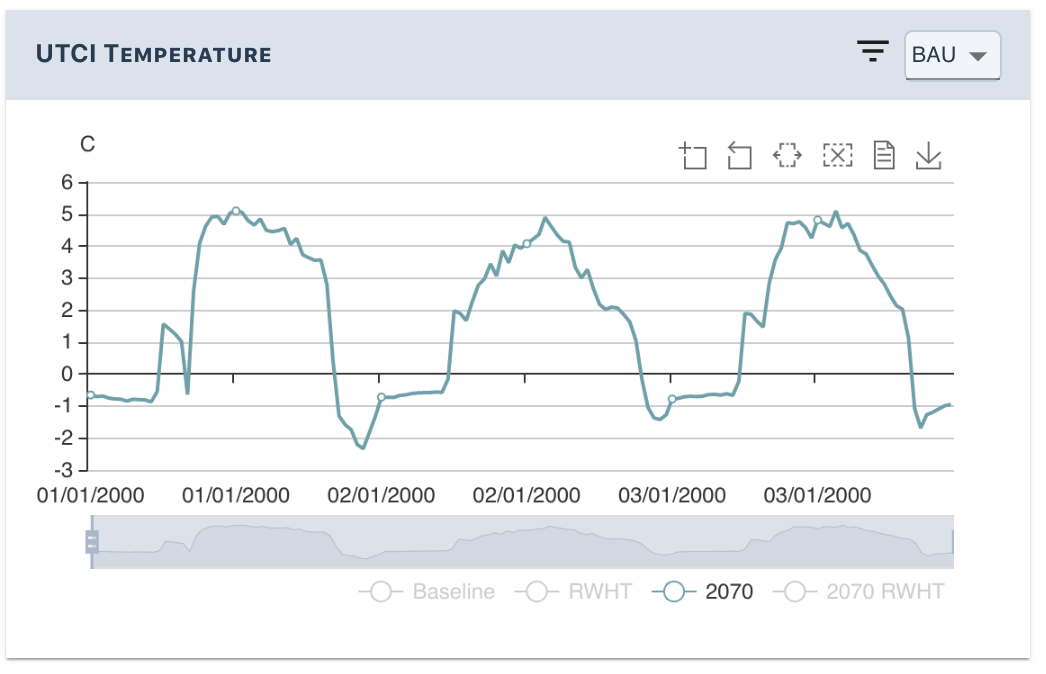
Viewing the Results
After the scenarios have been executed explore the impacts of the climate change scenarios.