Tutorial: Arden Macaulay, VIC case study exercise
Step 1: Getting familiar with the technical setup of the Baseline
In this exercise, we will simulate the Arden-Macaulay redevelopment project in the Scenario tool. The development project aims to transform the precinct into one of the best examples of urban regeneration internationally. The Arden Macaulay precinct is an area that is generally underutilised, particularly considering its proximity to the Central City. Urban renewal by the City of Melbourne will rejuvenate the precinct, turning it into a thriving and liveable place that supports a new community. Arden Macaulay is a highly urbanised and has a challenging flooding and drainage management catchment. Addressing drainage and flooding will be crucial to the long-term viability of the development precinct, especially when long-term changes to climate are factored in. (excerpt from Exec Summary of Arden Macaulay CRCWSC Technical Report)
1.1 New Project
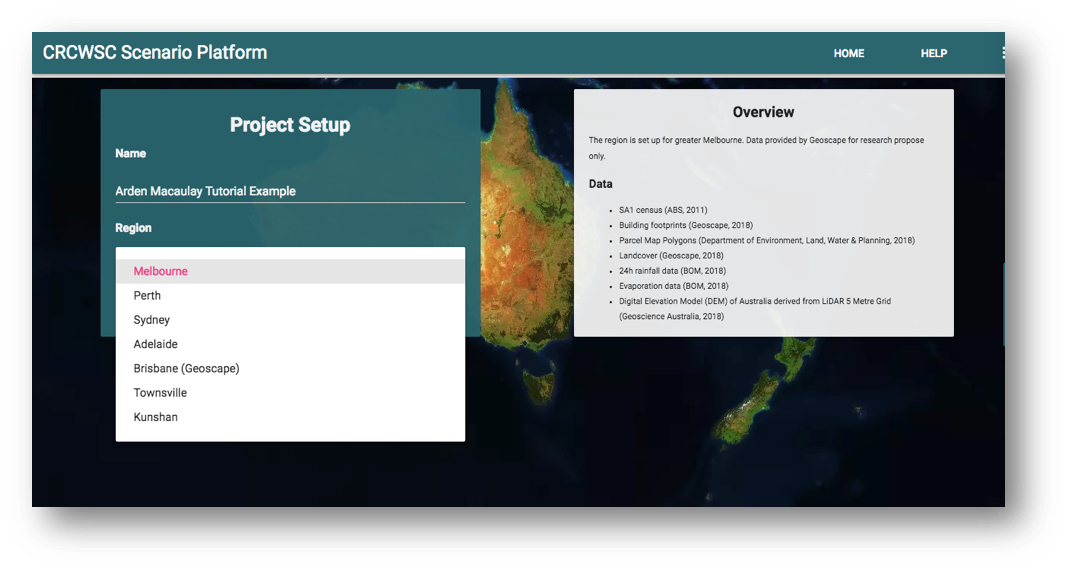
Create a new project with the name of your choice, select from the dropdown Region: Melbourne. The data available in the Scenario Tool is listed on the right side for users’ reference.
1.2 Model Selection
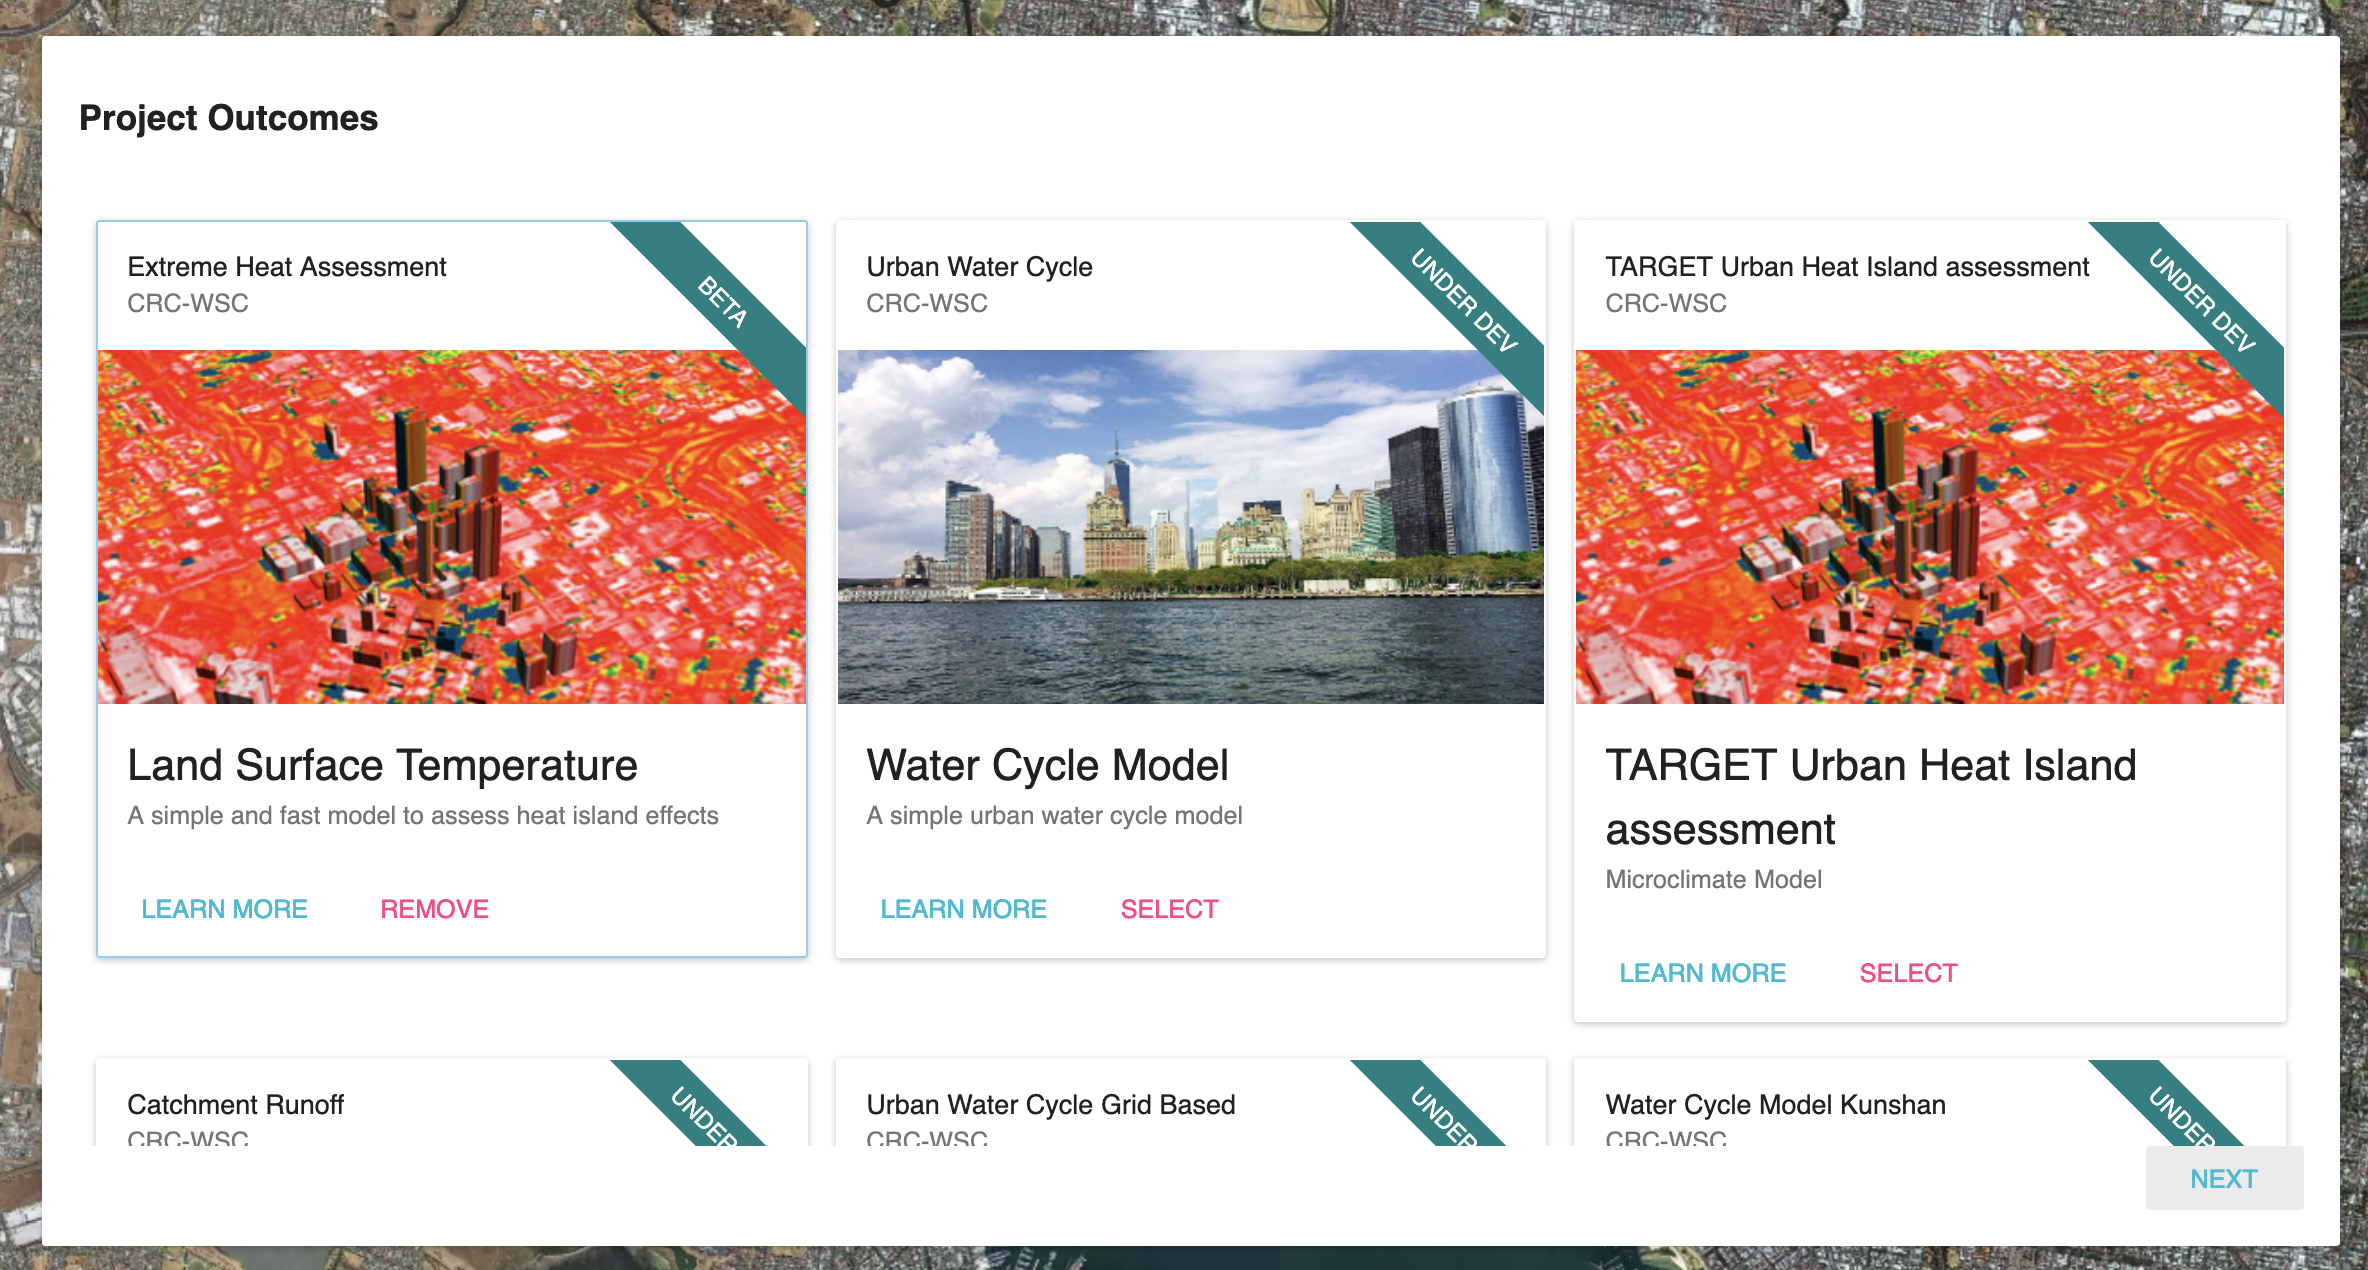
Select the models to be used in the Project. Choose from a list of modules currently available in Scenario Tool, and we’ll start by selecting the first module with documentation and submit.
Land Surface Temperature
1.3 GIS Data Input
The TAP team has prepared the data files for you to upload. Access this Dropbox link for the GIS files, download them for the rest of this exercise. Or copy and paste the below link to a new tab: https://www.dropbox.com/sh/ulhv3zyijk9aywh/AAChn_2uYBCeZyDVlYIjR3Qva?dl=0
1.4 Catchment definition
Define Catchment area for the project. Click on ‘UPLOAD FILE’, drag the Arden Macaulay boundary GeoJSON file into the given area, to outline the boundary shape of the spatial region for the project. Then click ‘Next’.

Define Catchment:
Upload |
Name As |
Explanation |
|---|---|---|
Arden Macaulay boundary |
Boundary |
The area of Arden Macaulay, a Major Urban Renewal Project - Structure Plan |
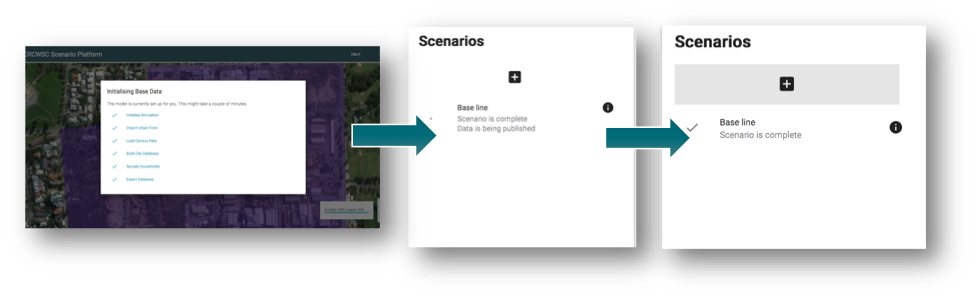
1.5 Baseline Data preparation
This may take up to 5 minutes for the baseline data for the area to be processed and uploaded. Then the baseline performance assessment will run the models previously selected, Land Surface Temperature and TARGET Urban Heat Island assessment. Watch the progress bar and the Scenario dashboard tile to make sure it says ‘Scenario is complete’ before the next step.
Step 2: Assess the baseline performance assessment
2.1 Review the baseline performance assessment
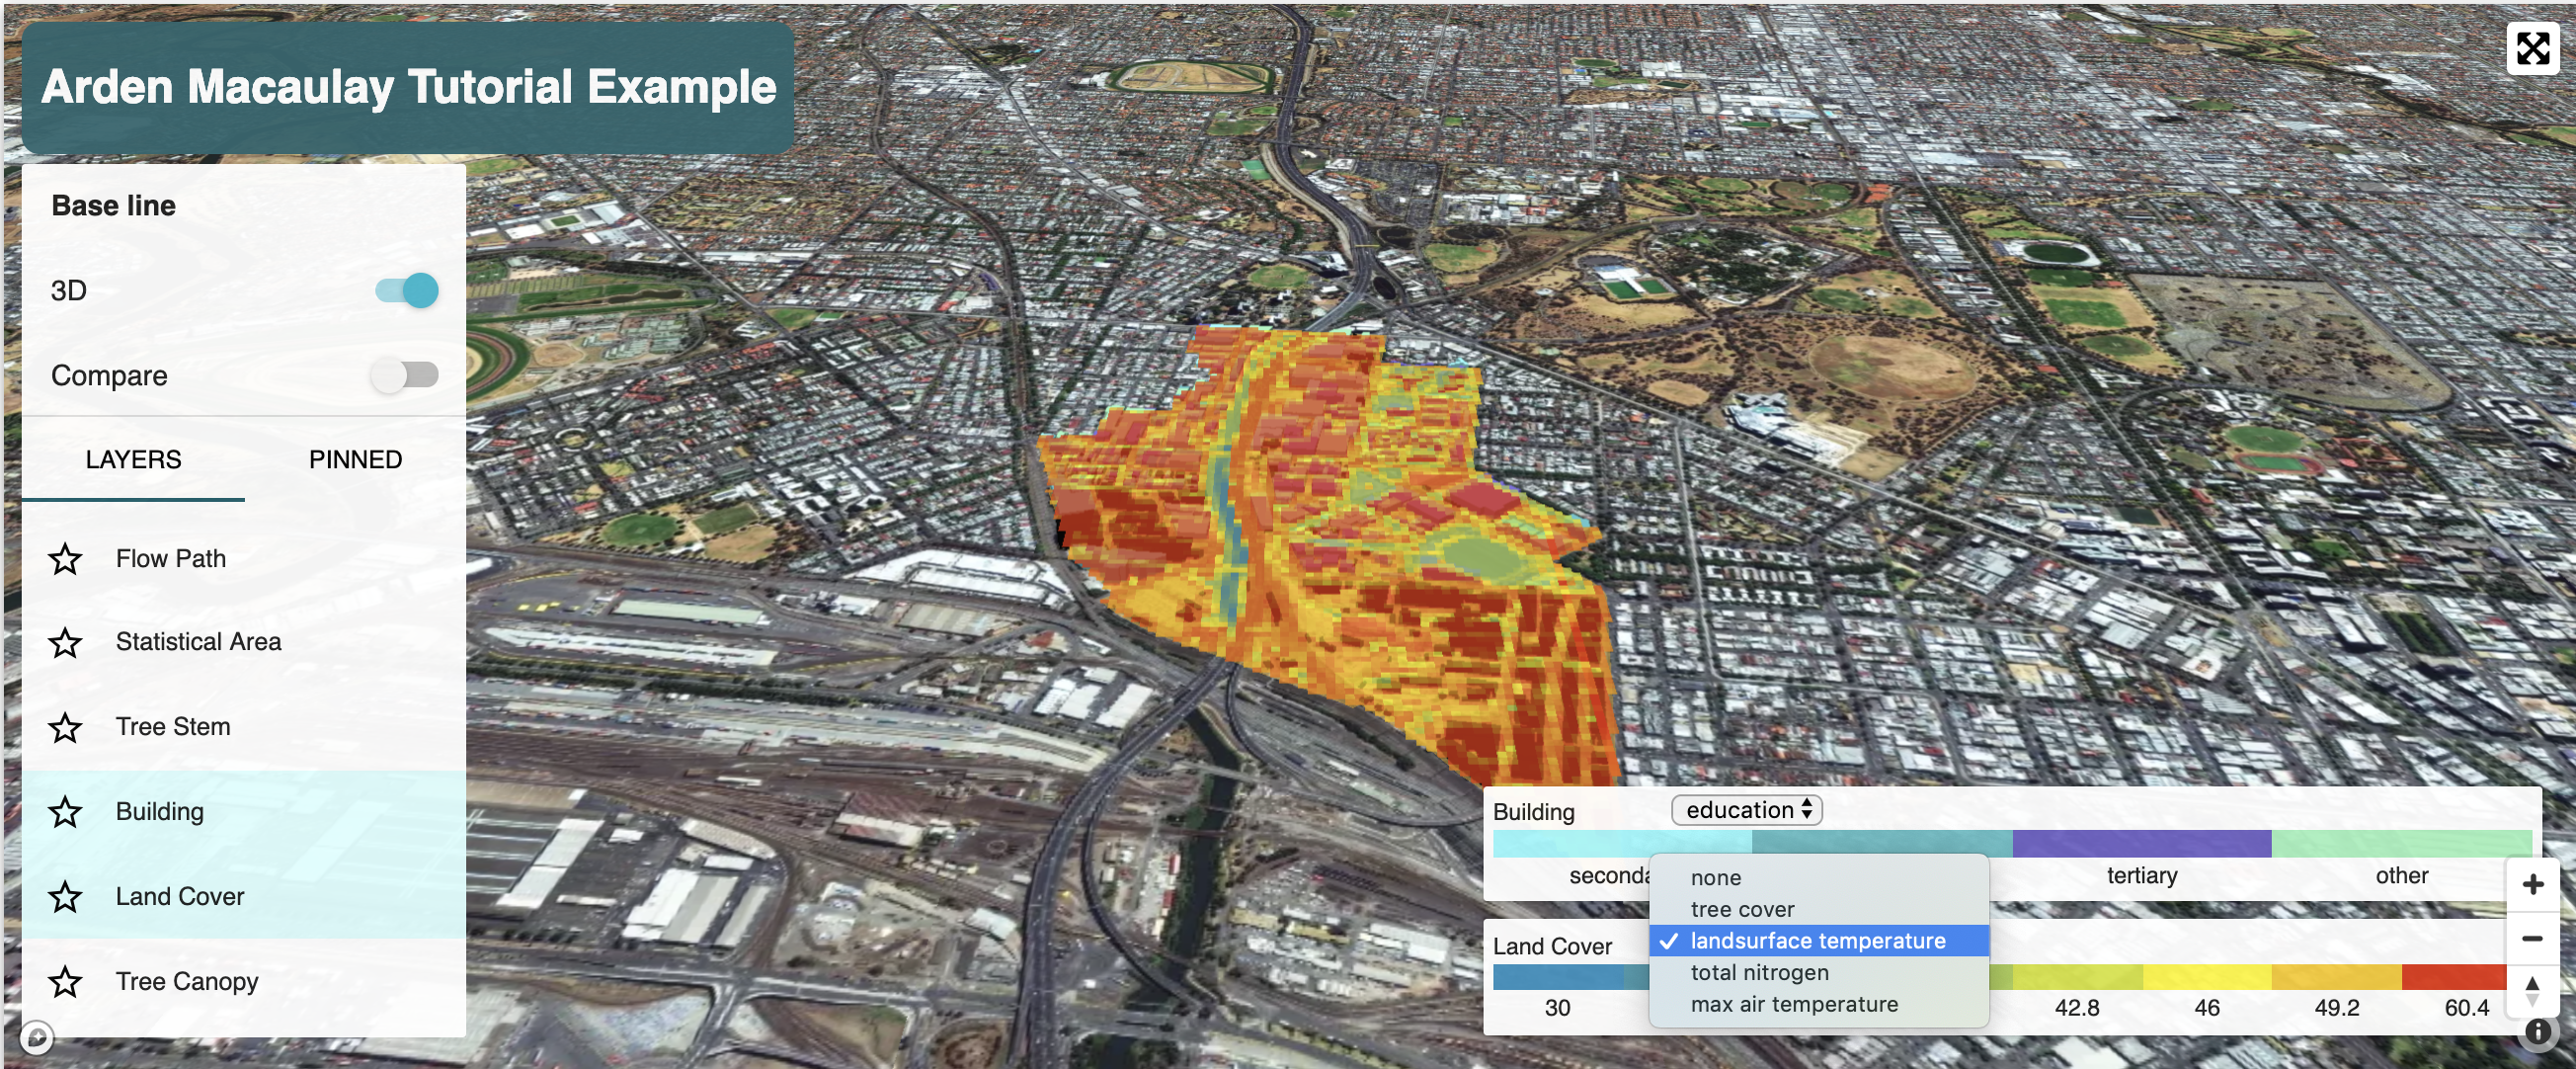
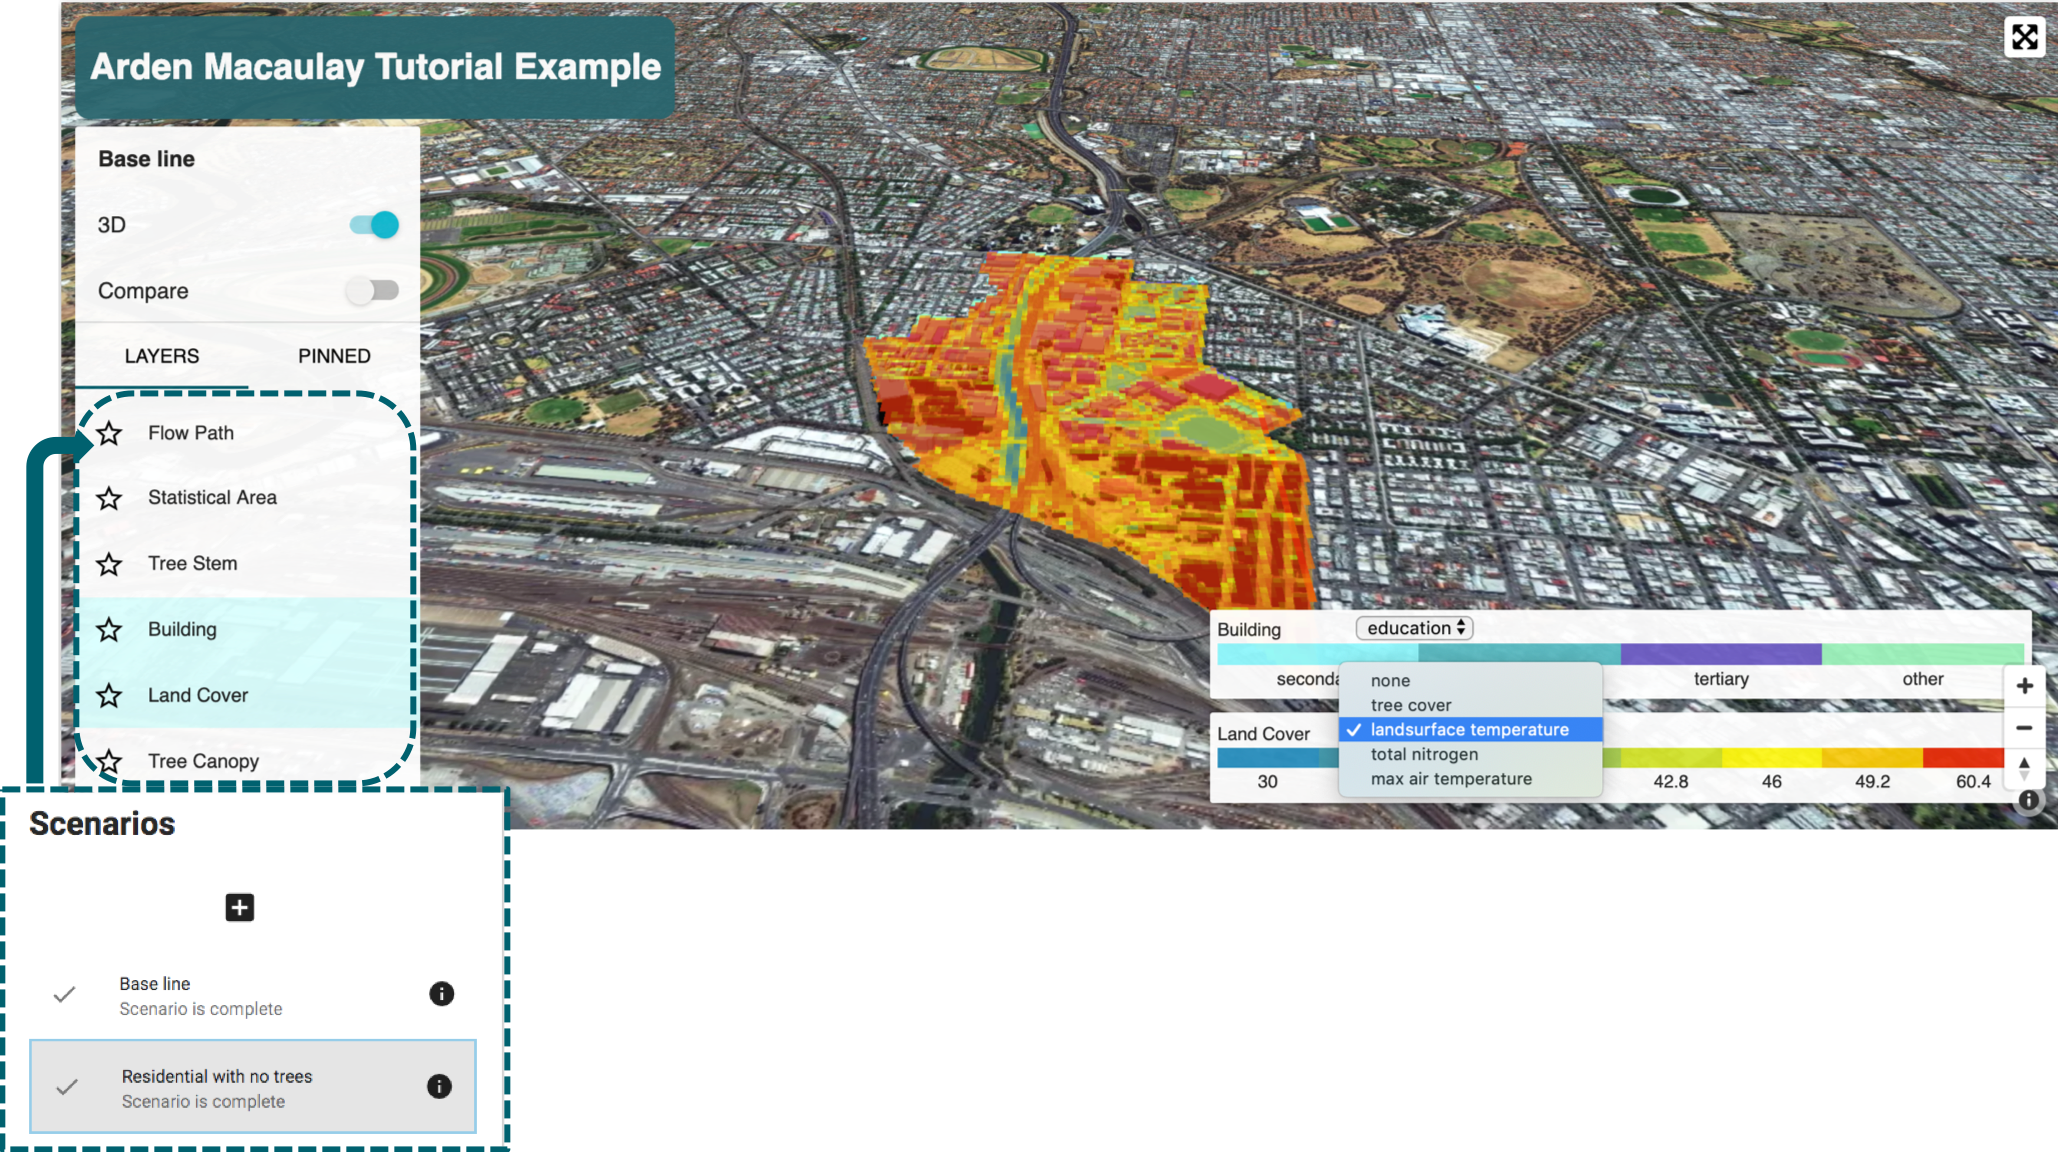
Click on ‘Base line’ scenario to view the map simulation and dashboard of tile outputs. Your account should then look like the following image (without the colors on the buildings yet). If any of the tiles are not displaying results after waiting for a few minutes, please Refresh the page. Then repeat previous steps. If the problem persists after starting from Step 1.1, contact TAP team for support.
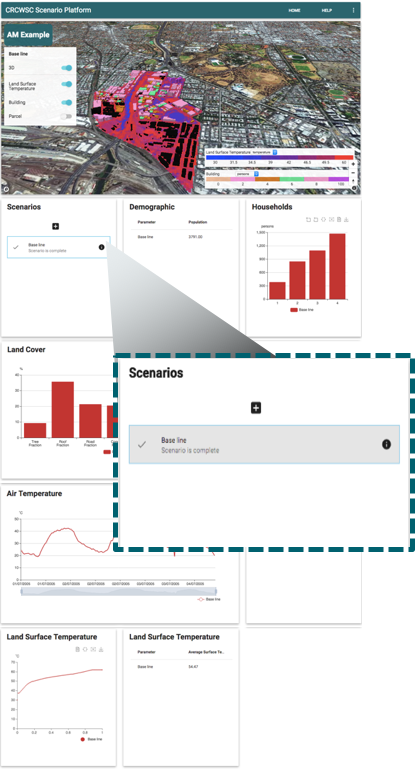
2.2 Description of each Dashboard tiles
Scenario: The control tile to create, manage, and compare scenario(s).
Demographic: displays the total residential population in the study area
Households: displays the proportions of different dwelling occupancies for the households within the study area.
Land Cover: displays the land cover fraction of the catchment boundary area in the scenario (this tile is useful for assessing changes in land cover).
Land Surface Temperature: shows the cumulative frequency of the land surface temperature assigned to each grid block by way of the land cover contained within the cell. And displays the numerical average land surface temperature.
Note: On the map interface, click the ‘Land Cover’ to visualise the land surface temperature results spatially over the satellite image. You can toggle the legend drop down to view tree cover, and more heat maps. And clicking the ‘Building’ layer generates the demographic breakdown of the study area population from ABS Census data. This can be modified to show persons, education, income, and built year (under dev.).
Step 3: Design the Scenario(s)
The scenario feature allows users to undergo an exploratory modelling approach towards understanding and developing transitions strategy options. In order to simplify this process for first time users and test repeatability, we will follow CRCWSC’s Arden Macaulay Urban Renewal Plan using only one adaptation node per scenario. Adaptation node(s) represent different development and adaptation options users can create to design the scenario. They can be layered onto the baseline scenario or a previously run scenario (i.e. they are stackable). We will run the following three scenarios to evaluate each adaptation node’s incremental impact:
Scenario 1: Residential Development with no trees
Scenario 2: Scenario 1 + Green Infrastructures (Green Roof + Wetlands)
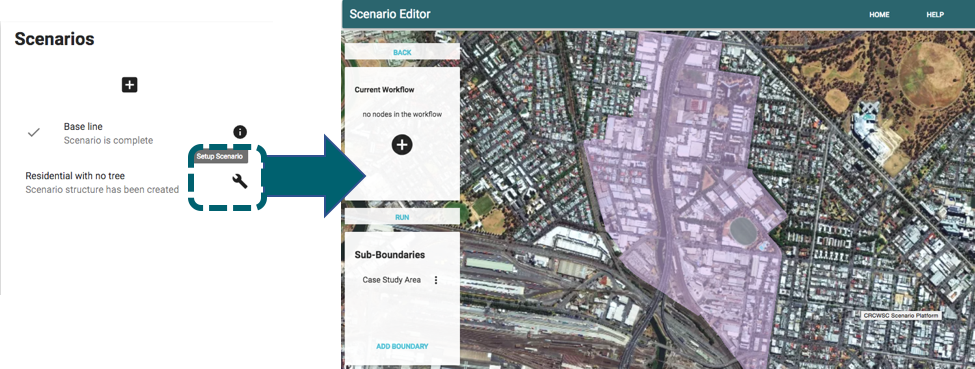
In the future, node parameters can be automated by uploading existing building codes and policy information provided by stakeholders. Your scenario screen at the end of the below steps should look like the following image.
NOTE: Click on ‘NEW WINDOW’ in the Help section to open this tutorial in a new tab. This will be necessary for the following steps to make it easier to see the parameter inputs of the adaptation nodes.
3.1 Create the first scenario
Add a new scenario, Name it “Residential with no trees”, put on Baseline Layer, and click Add. Then click on the wrench tool icon to “Setup Scenario”.
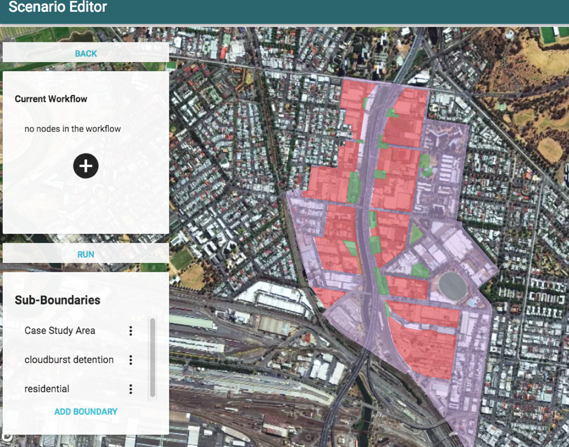
3.2. Upload the Sub-Boundaries
Select ‘Add Boundary’ and ‘to repeat the previous steps of upload or drag & drop the GIS files in the Dropbox folder called Step 3: Design Scenario. This draws the sub-sections within the boundary catchment for each adaptation node to be added in the scenarios. Choose a different color for each sub-boundary so it’s easier to differentiate them visually in the next steps. Refer to the Table below for further explanations. WARNING: Please do repeat this step for each file, because the does not support multiple file uploads.
Upload |
Name As |
Explanation |
|---|---|---|
Residential area |
Residential |
Areas zoned for new urban residential development. |
Cloudburst detention area |
Cloudburst detention |
New public space defined for public installation of cloudburst detention technology to reduce flood damage and increase green cover. |
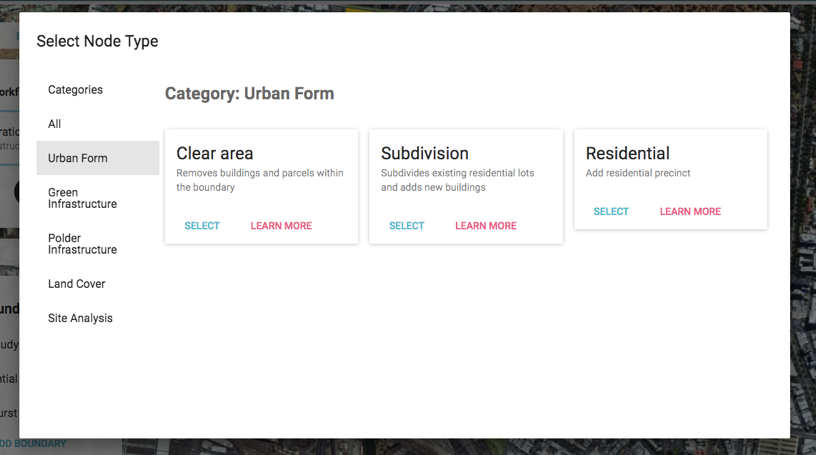
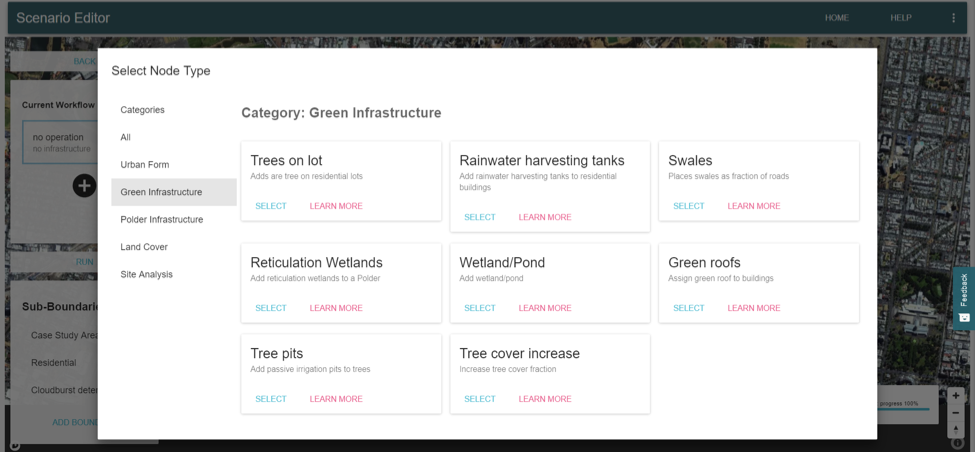
3.3. Add the Scenario Adaptation Nodes
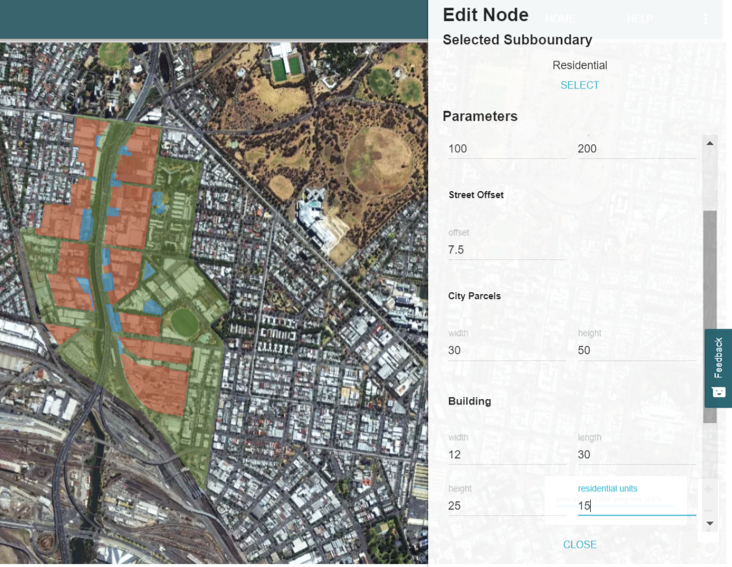
In the Current Workflow box, select the PLUS button to add an adaptation node. You’ll find the “Residential” node under the category: Urban Form. Then use the below table’s parameter information to create Scenario 1’s Residential development to match those outlined in the Arden-Macaulay redevelopment project under a business as usual scenario. Please make sure you select the sub-boundary: Residential, so development is only applied in the appropriate zones. NOTE: One node -> one sub-boundary
Scenario 1: New residential development without trees
Adaptation Node |
Urban Form: Residential |
Sub-Boundary Area |
Residential |
Parameters |
City Blocks Width: 100 City Blocks Depth: 200 Street Offset: 7.5 Parcel Width: 30 Parcel Height: 50 Building Width: 12 Building Length: 30 Building Height: 25 Building Unit: 15 Building Hardstand: 0.6 Building Garden: 0.3 Tree Spacing: 500 |
Intended output |
Meet population density needs with BAU |
REMINDER: Each adaptation node needs to be applied to the specific sub-boundary file uploaded in the previous step 3.2. (e.g. applying Residential node to Residential sub-boundary will only add residential buildings on the Residential sub-boundary, and not the entire case study boundary)
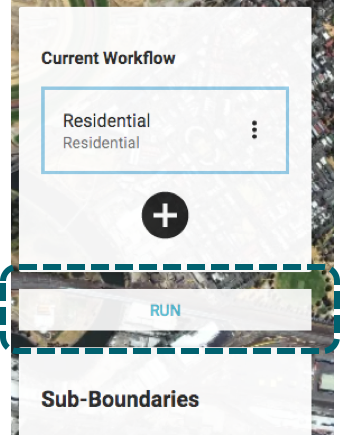
3.4. Run the Adaptation Node
Click on ‘Run’ to build the models based on the parameters submitted. Wait for the simulation to finish setting up before continuing to assess the scenario results.
3.5. Wait for the model to finish running the previous scenario
Since we’re stacking the scenario on the previous scenario, we need to wait for the model to finish building and assess the results of each scenario before proceeding to the next scenario. This is key, and could cause problems otherwise. If this is not clear, please contact TAP team for clarification.
Select the Scenario 1: Residential with no trees. Repeat step 2.2 and click on the toggles on the visualisation map to enable the individual building & land surface temperature layers.
3.6. Additional Scenario
Create scenario 2 on top of the previous scenario layer. That is, create Scenario 2 and change the base layer to Scenario 1: Residential, rather than the Base Line.
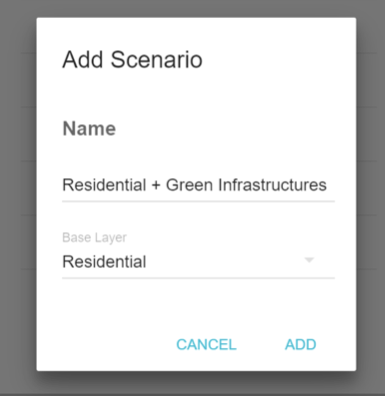
Then repeat steps 3.3 except with new Green Infrastructure nodes: Green Roof and Ponds/Wetlands. This will simulate the newly proposed green infrastructure options proposed in the Arden Macaulay re-development plan.
Scenario 2: Increase green roof and add wetlands on designated cloudburst detention locations
Adaptation Node |
Green Infrastructure: Green Roof |
Green Infrastructure: Ponds/Wetlands |
Sub-Boundary |
Residential |
Cloudburst detention |
Parameters |
1 fraction |
0.8m |
Intended output |
Reduce land surface temperature |
Increase water cover |
Then repeat step 3.4 to run the performance assessment. Note that if the parameter dialogue box is brought up again after being submitted, the variable values will need to be inputted again.
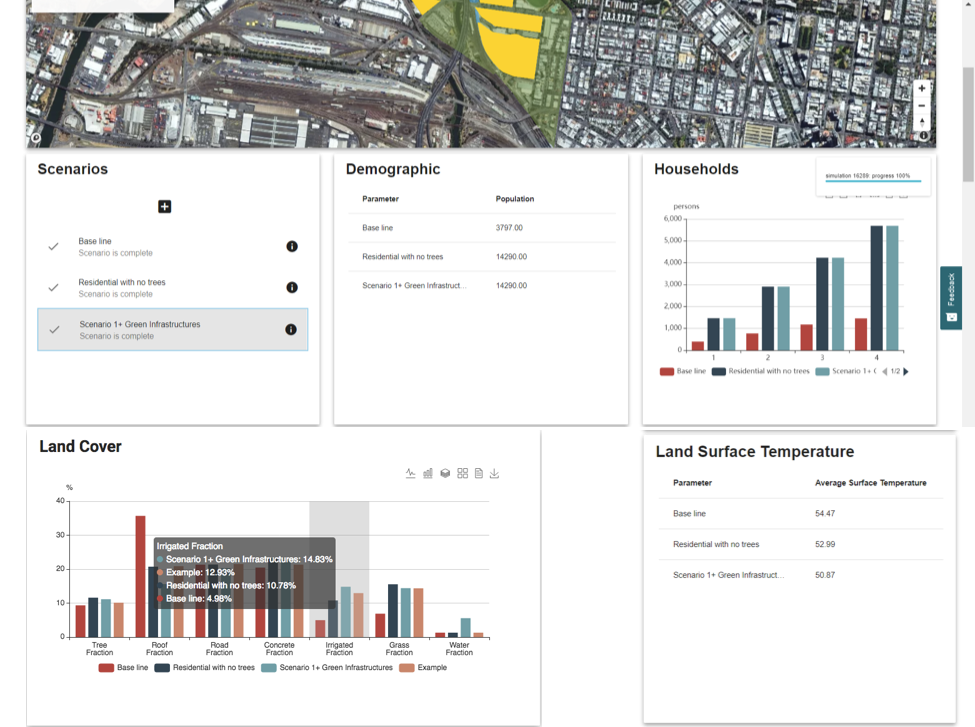
Step 4: Evaluate and compare outcomes of each scenario design
Evaluate the 3 scenarios created by looking through the dashboard charts. The visualisation screen’s scenario is set by the one highlighted/greyed in the scenario panel. We suggest comparing the below graphic’s results to your own, and seeing if the modelled data matches up.
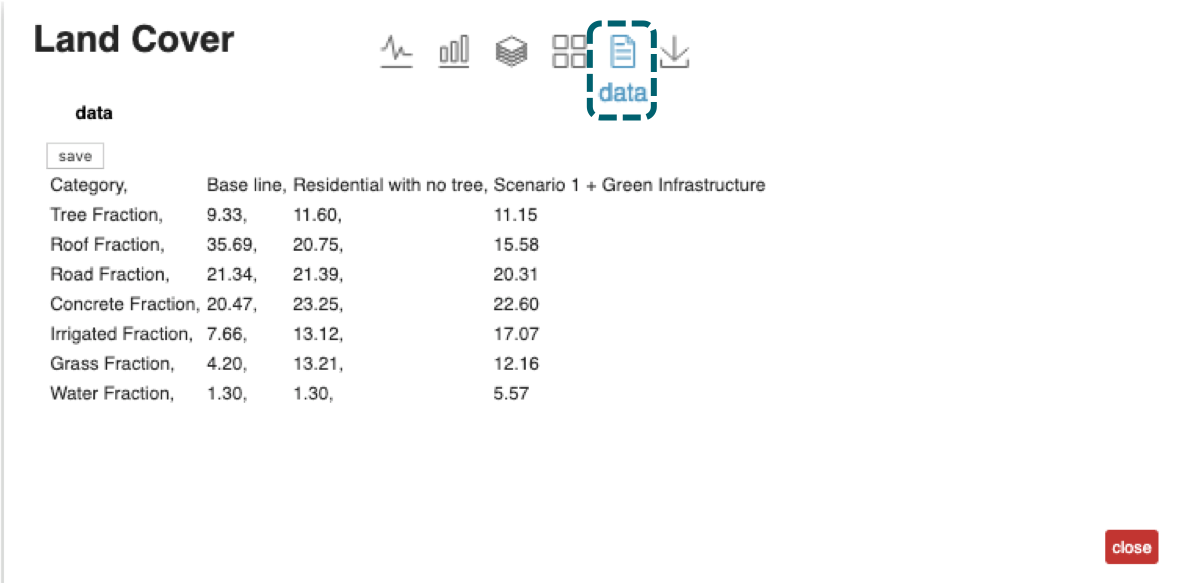
Use the micro-icons on each chart to manipulate the data. You can also download the data (a simple csv file) behind the charts by clicking on the ‘Data’ icon, then clicking ‘save’. The download feature with GIS data and comprehensive simulation data sets will be made available to advanced users in the future.
Step 5: Trial your own with a new project in your own region. More to come in future Training Seminars.
Looking for more guidance in another case study? Try the next exercise – Knutsford, WA, where we focus on developing open space and green spines in an industrial turned residential precinct area north of Fremantle.