Quick Start Guide
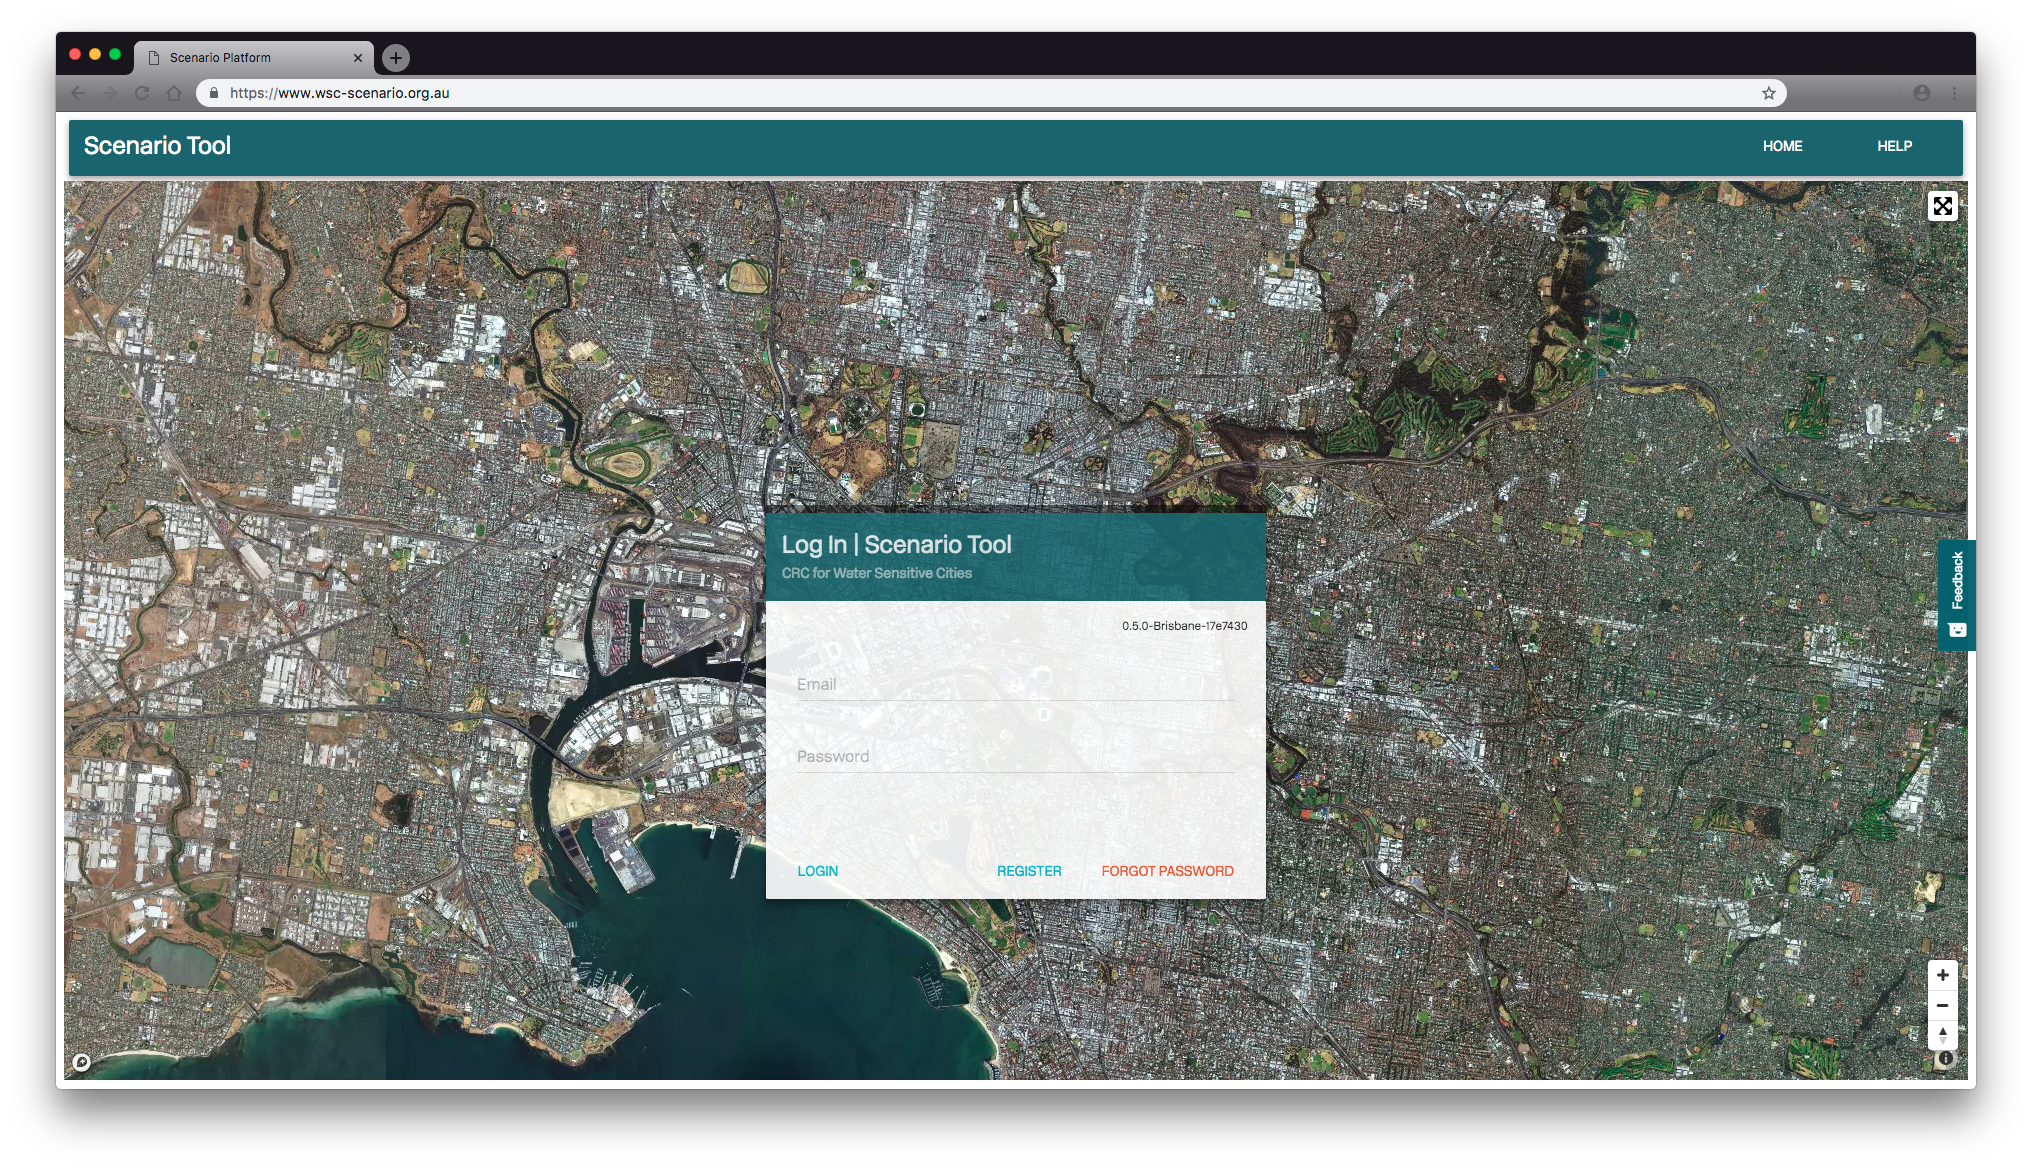
Navigate to the login page for the Tool (Google Chrome is preferred).
If you have not done so already, register for access by clicking the ‘Register’ button. Confirm the relevant details using your corporate email address (including whether or not you are a CRCWSC participant), then click ‘Register.’ A non-disclosure agreement summary form will show up, check the box for ‘I Agree’, then ‘Accept.’ Now you’ve successfully registered!
To go back to the login screen, click ‘Login’. Enter in your email and password, click on the ‘Login’ button, and accept the disclaimer.
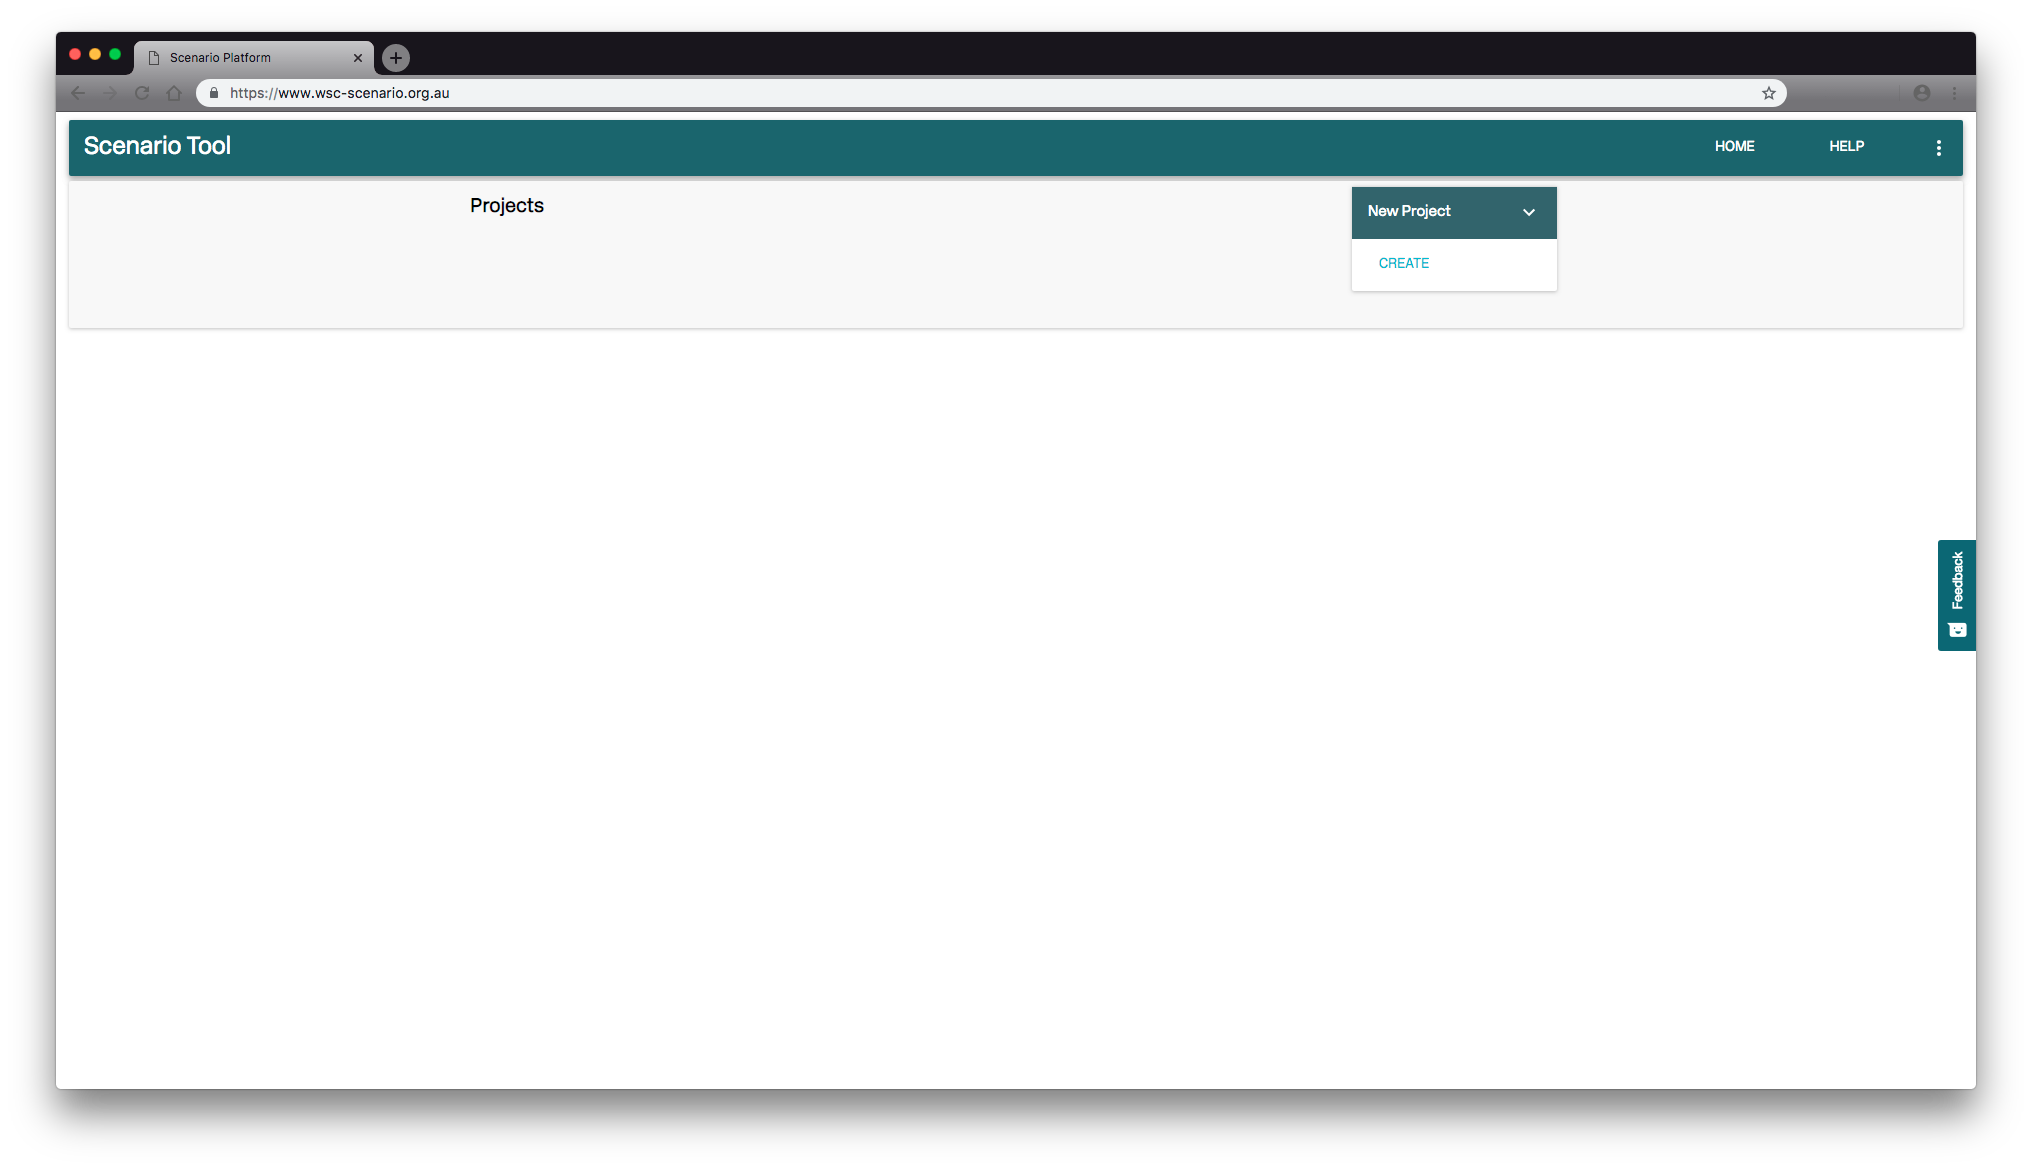
Select ‘Create’ under the ‘New Project’ tile.
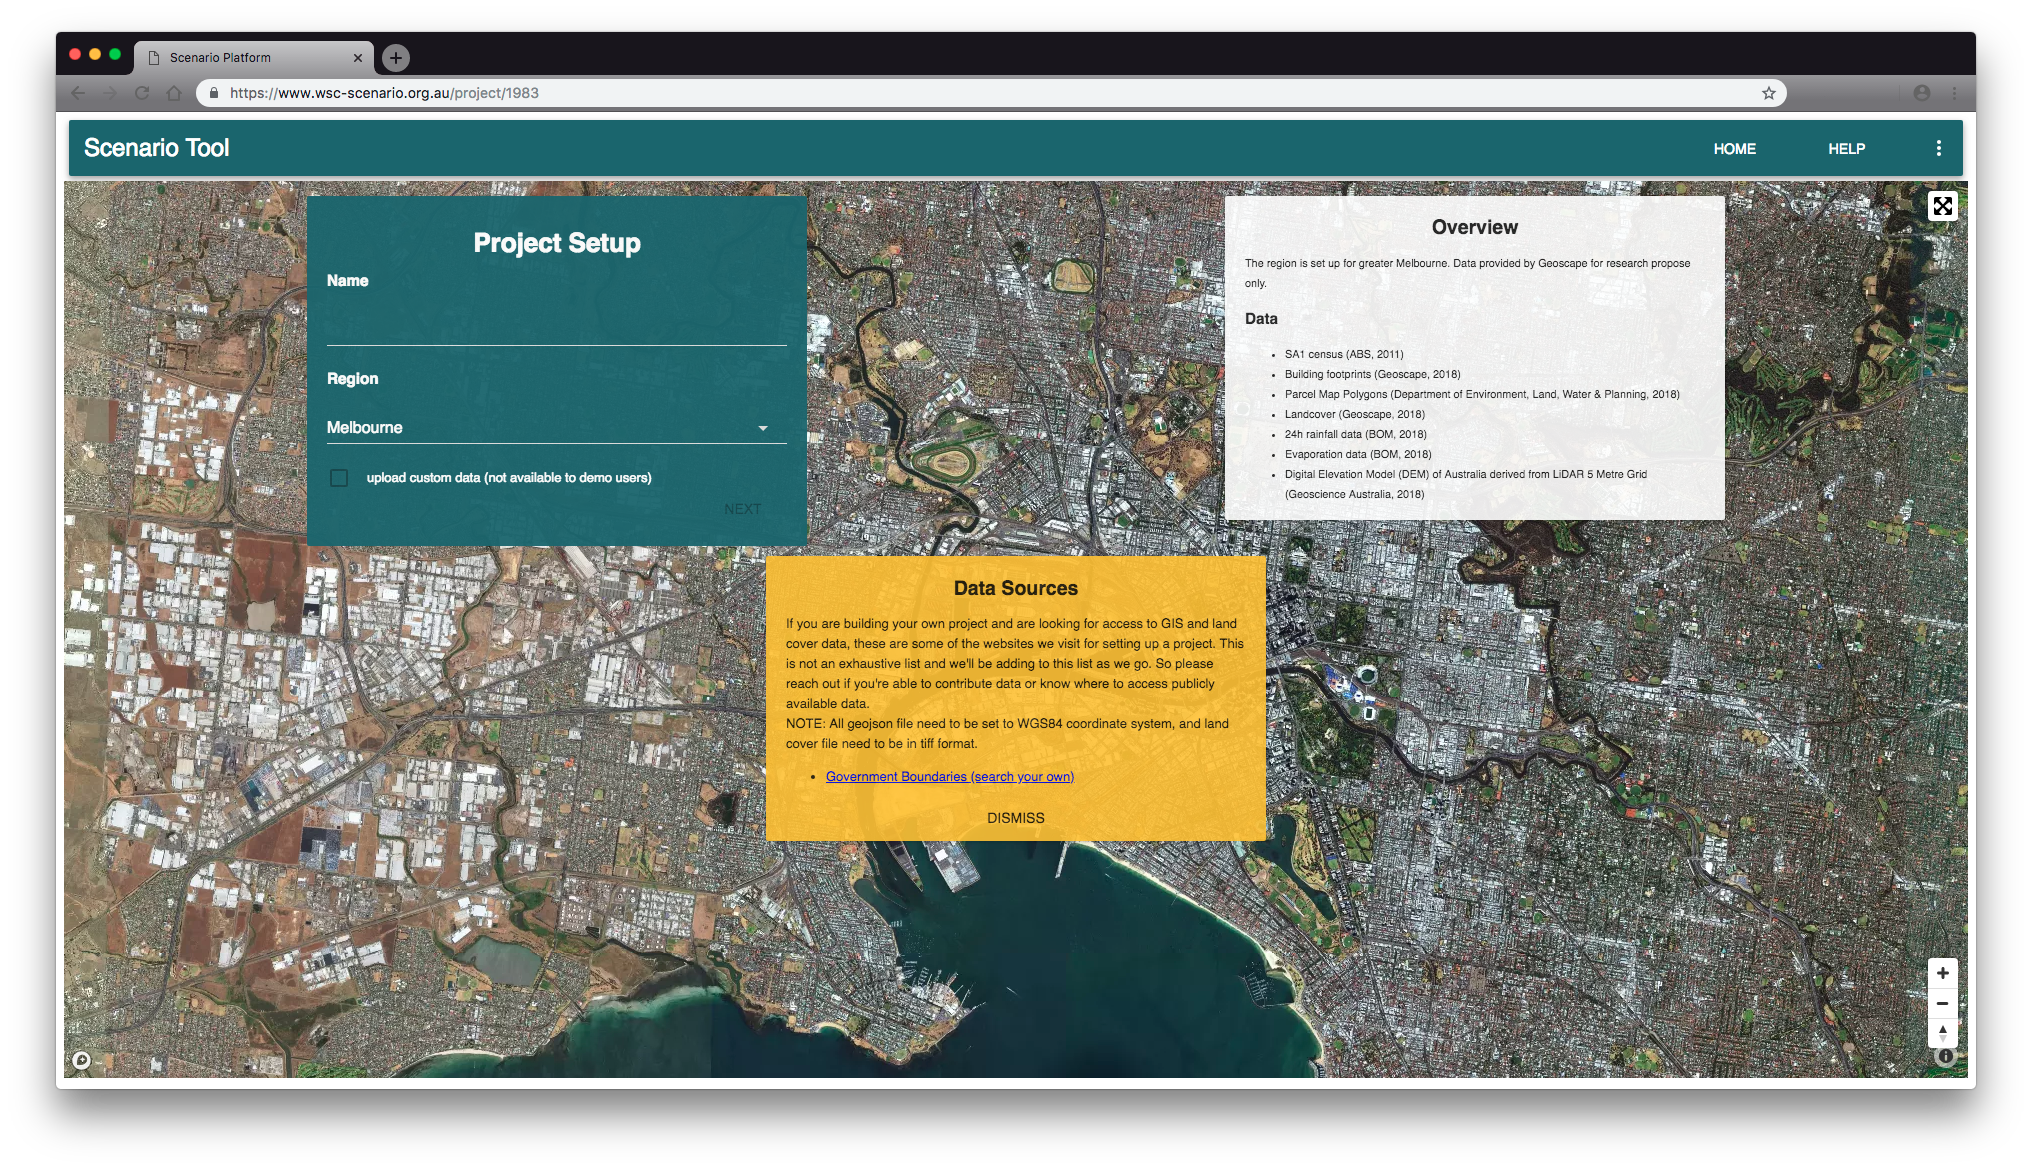
Dismiss the data sources pop-up, and then enter in a name for your project and select the metropolitan area it is based within, and then click ‘Next’.
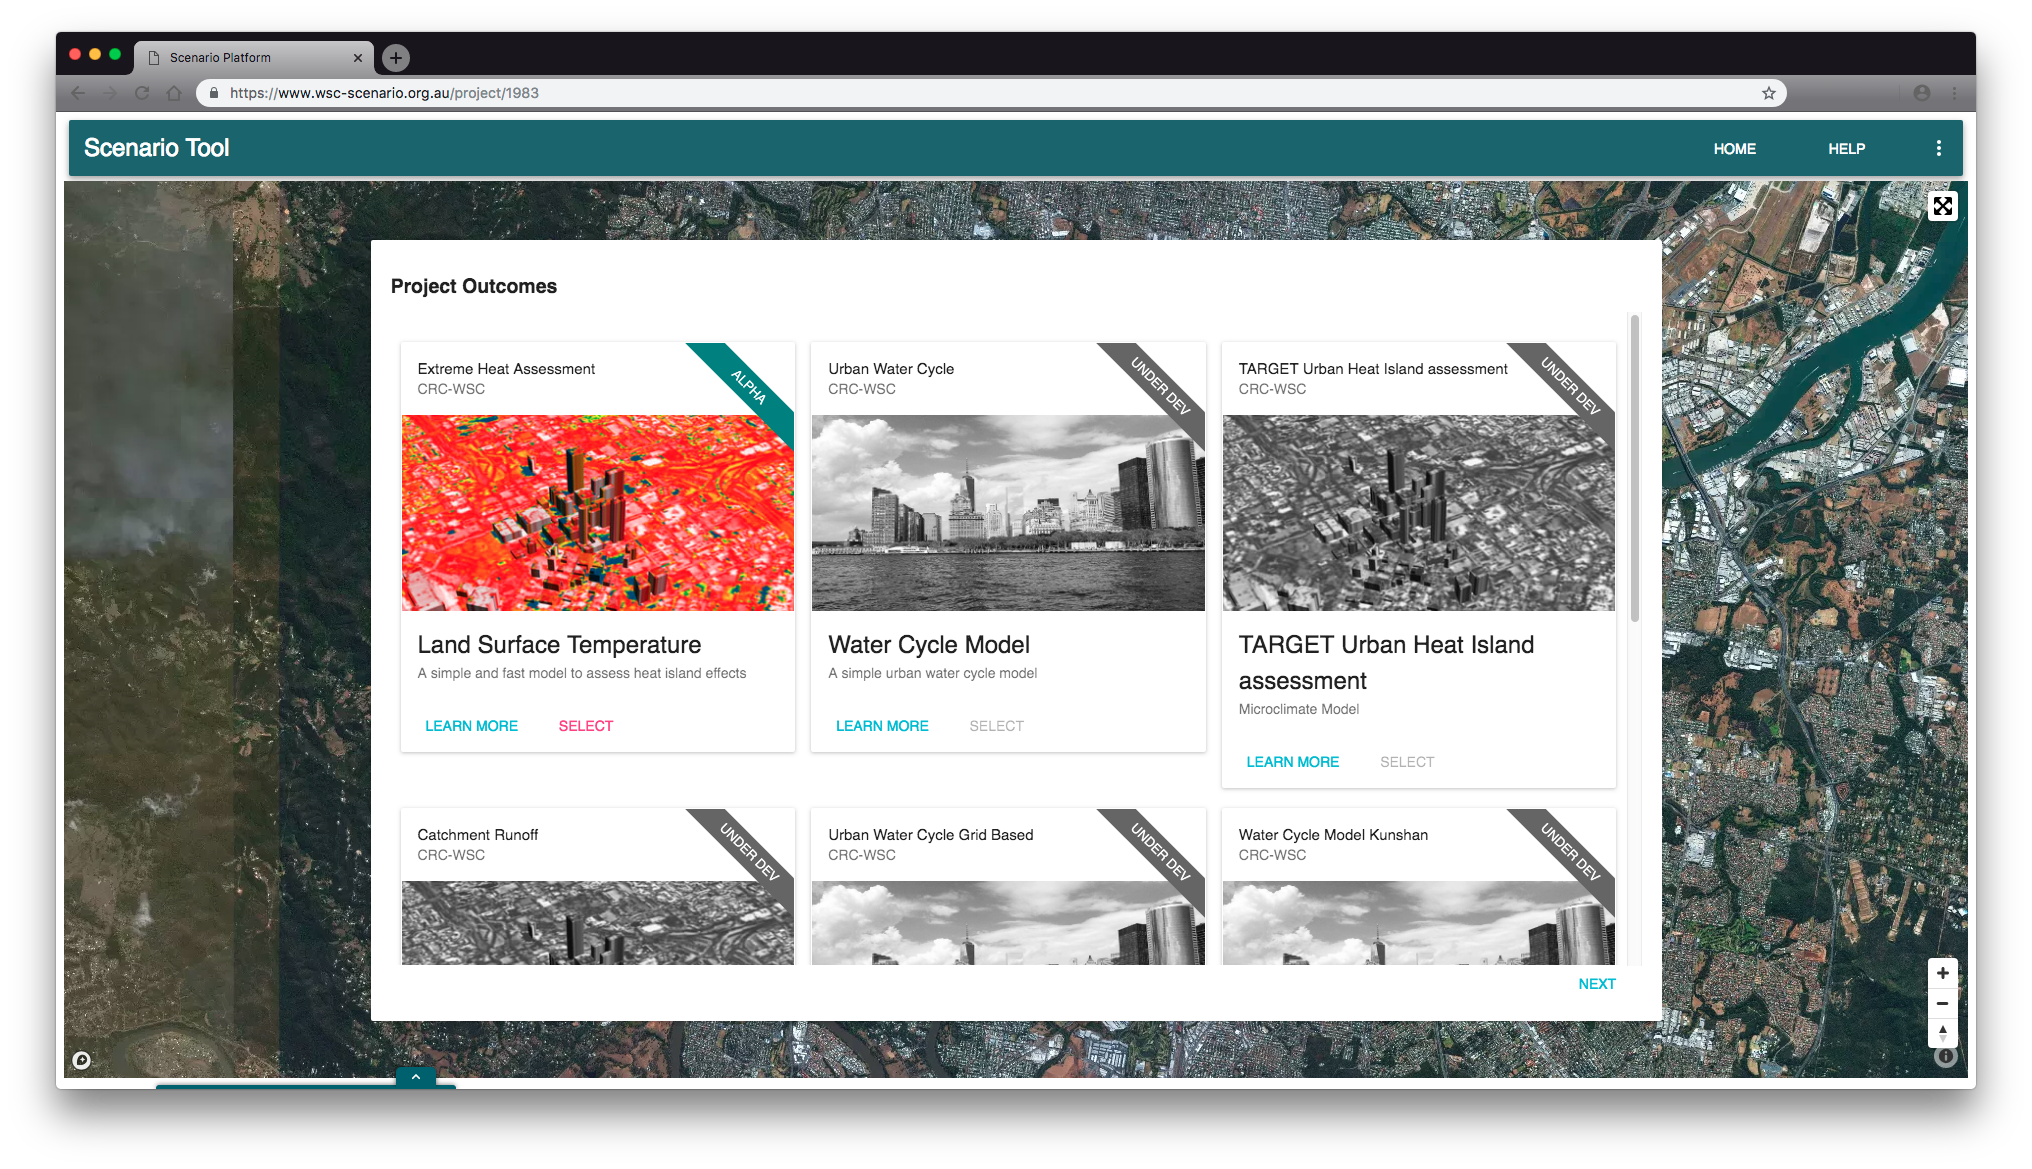
Select the Land Surface Temperature module, and then hit ‘Next’.
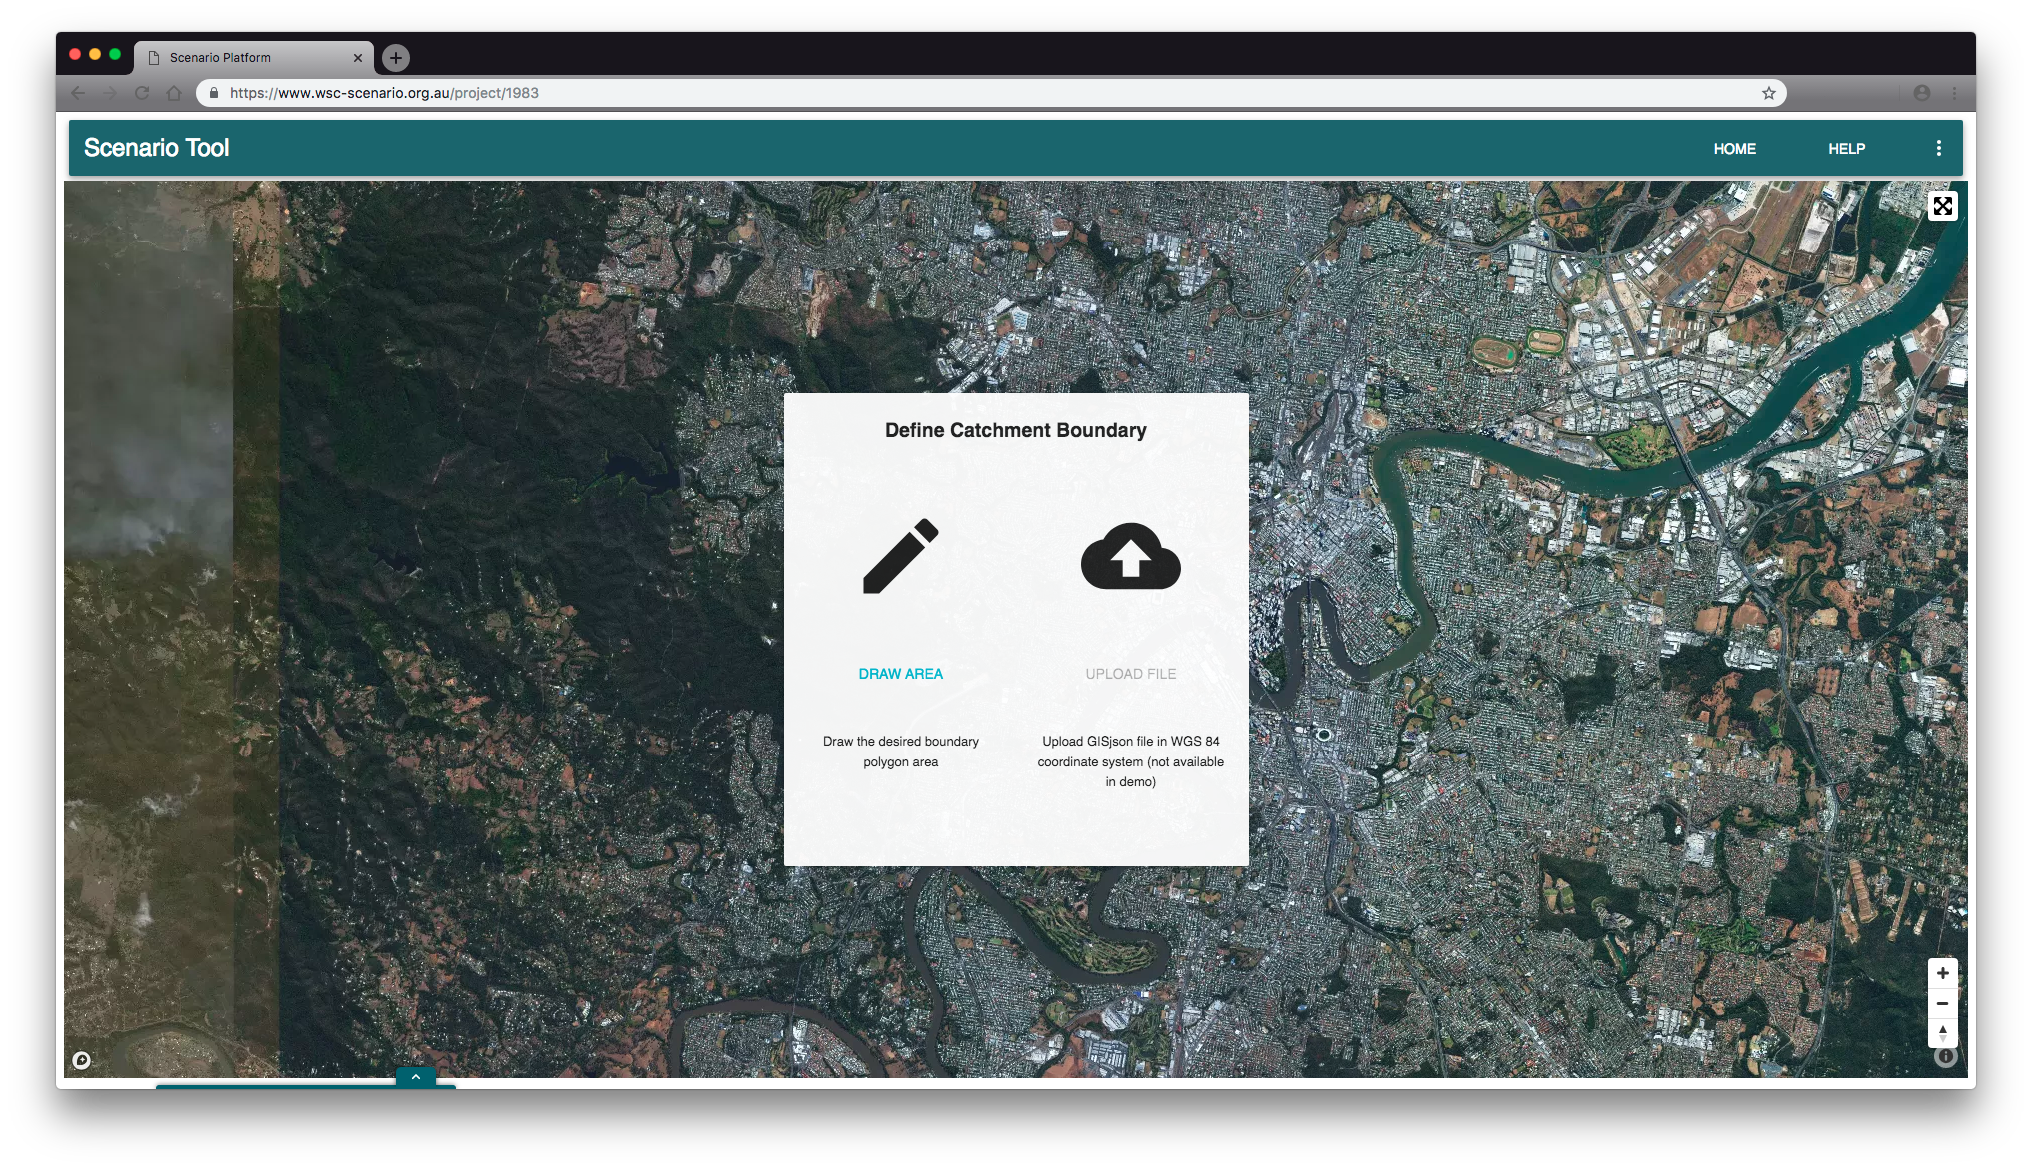
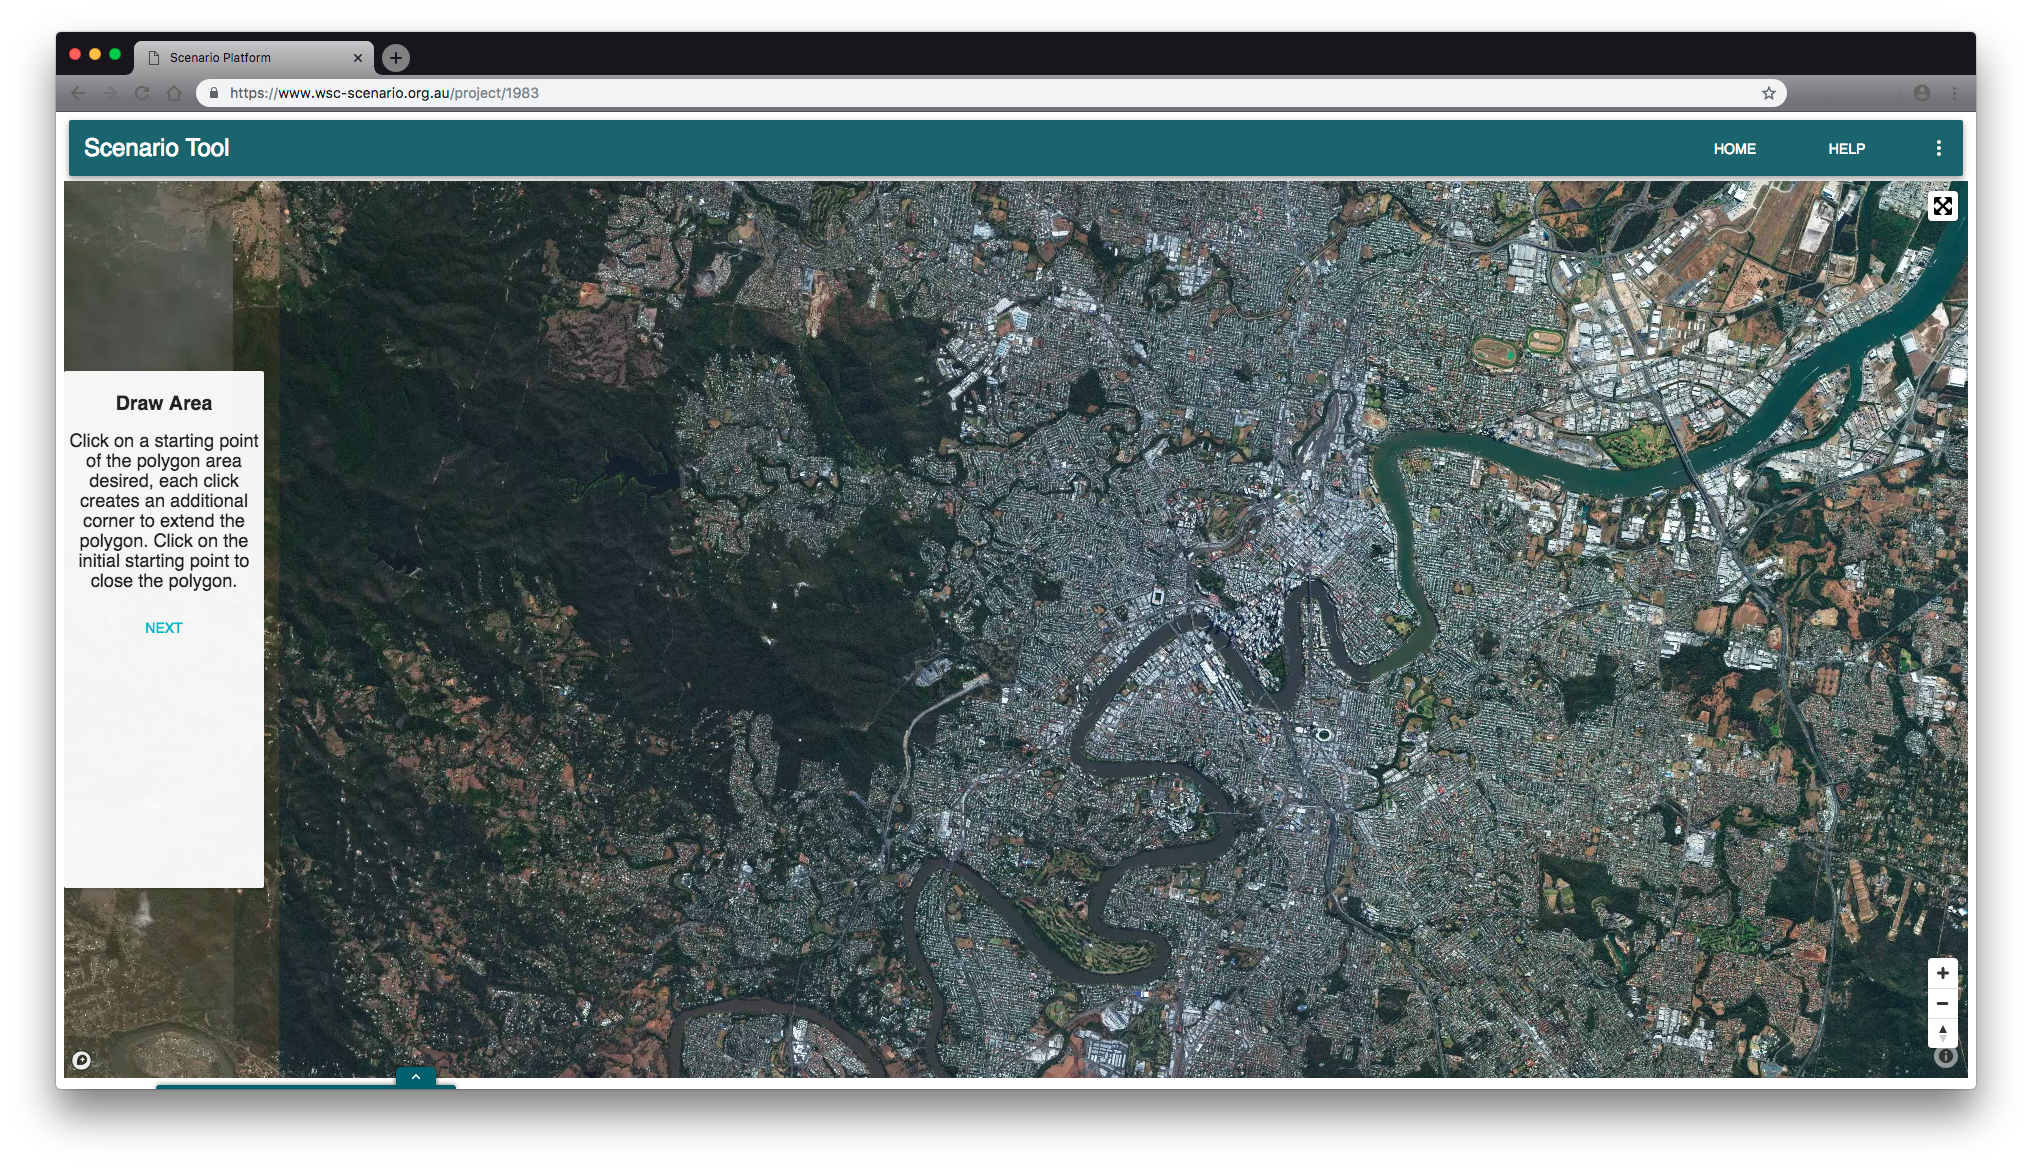
Click on ‘Draw Area’, and then click and draw the boundary of your project area, remembering to complete the boundary by clicking on the first vertex created (the region must be kept to four hectares – if it is too large a pop-up will appear and you will have to redraw an area). Once the boundary has been established, click ‘Next’ within the “Draw Area’ pane.
You will be taken to the main project dashboard, while the baseline simulation is completed. Tiles displaying output related to the chosen module (once the simulation is finished) will be shown.
The demographics tile states the population count for the project area.
The household tile displays the proportions of different dwelling occupancies for the households within the study area.
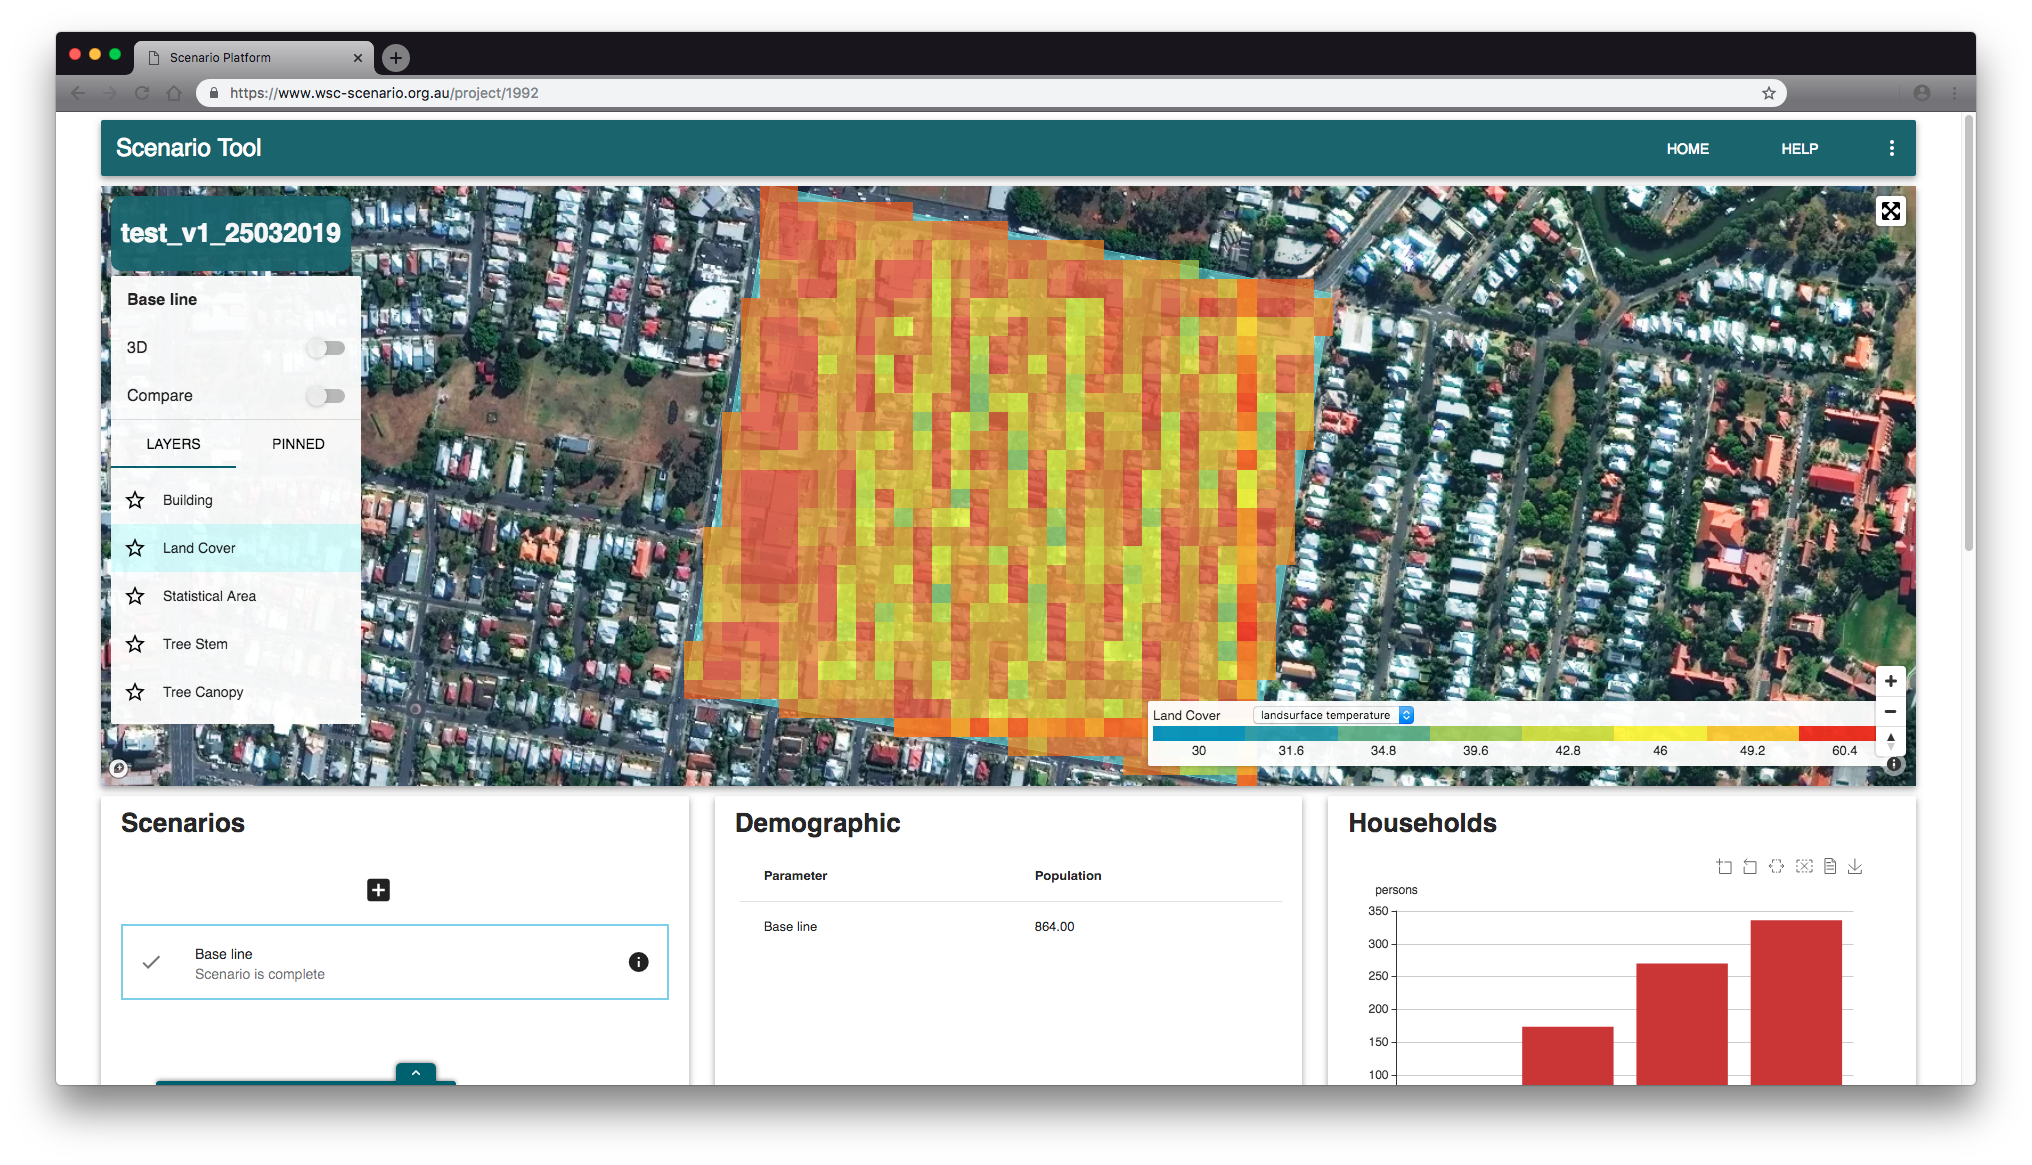
The land cover tiles describes the different proportions of land cover contained within the project boundary.
The land surface temperature tiles show (1) the cumulative frequency of the land surface temperature assigned to each grid block, and (2) the average surface temperature of the study area for each scenario.
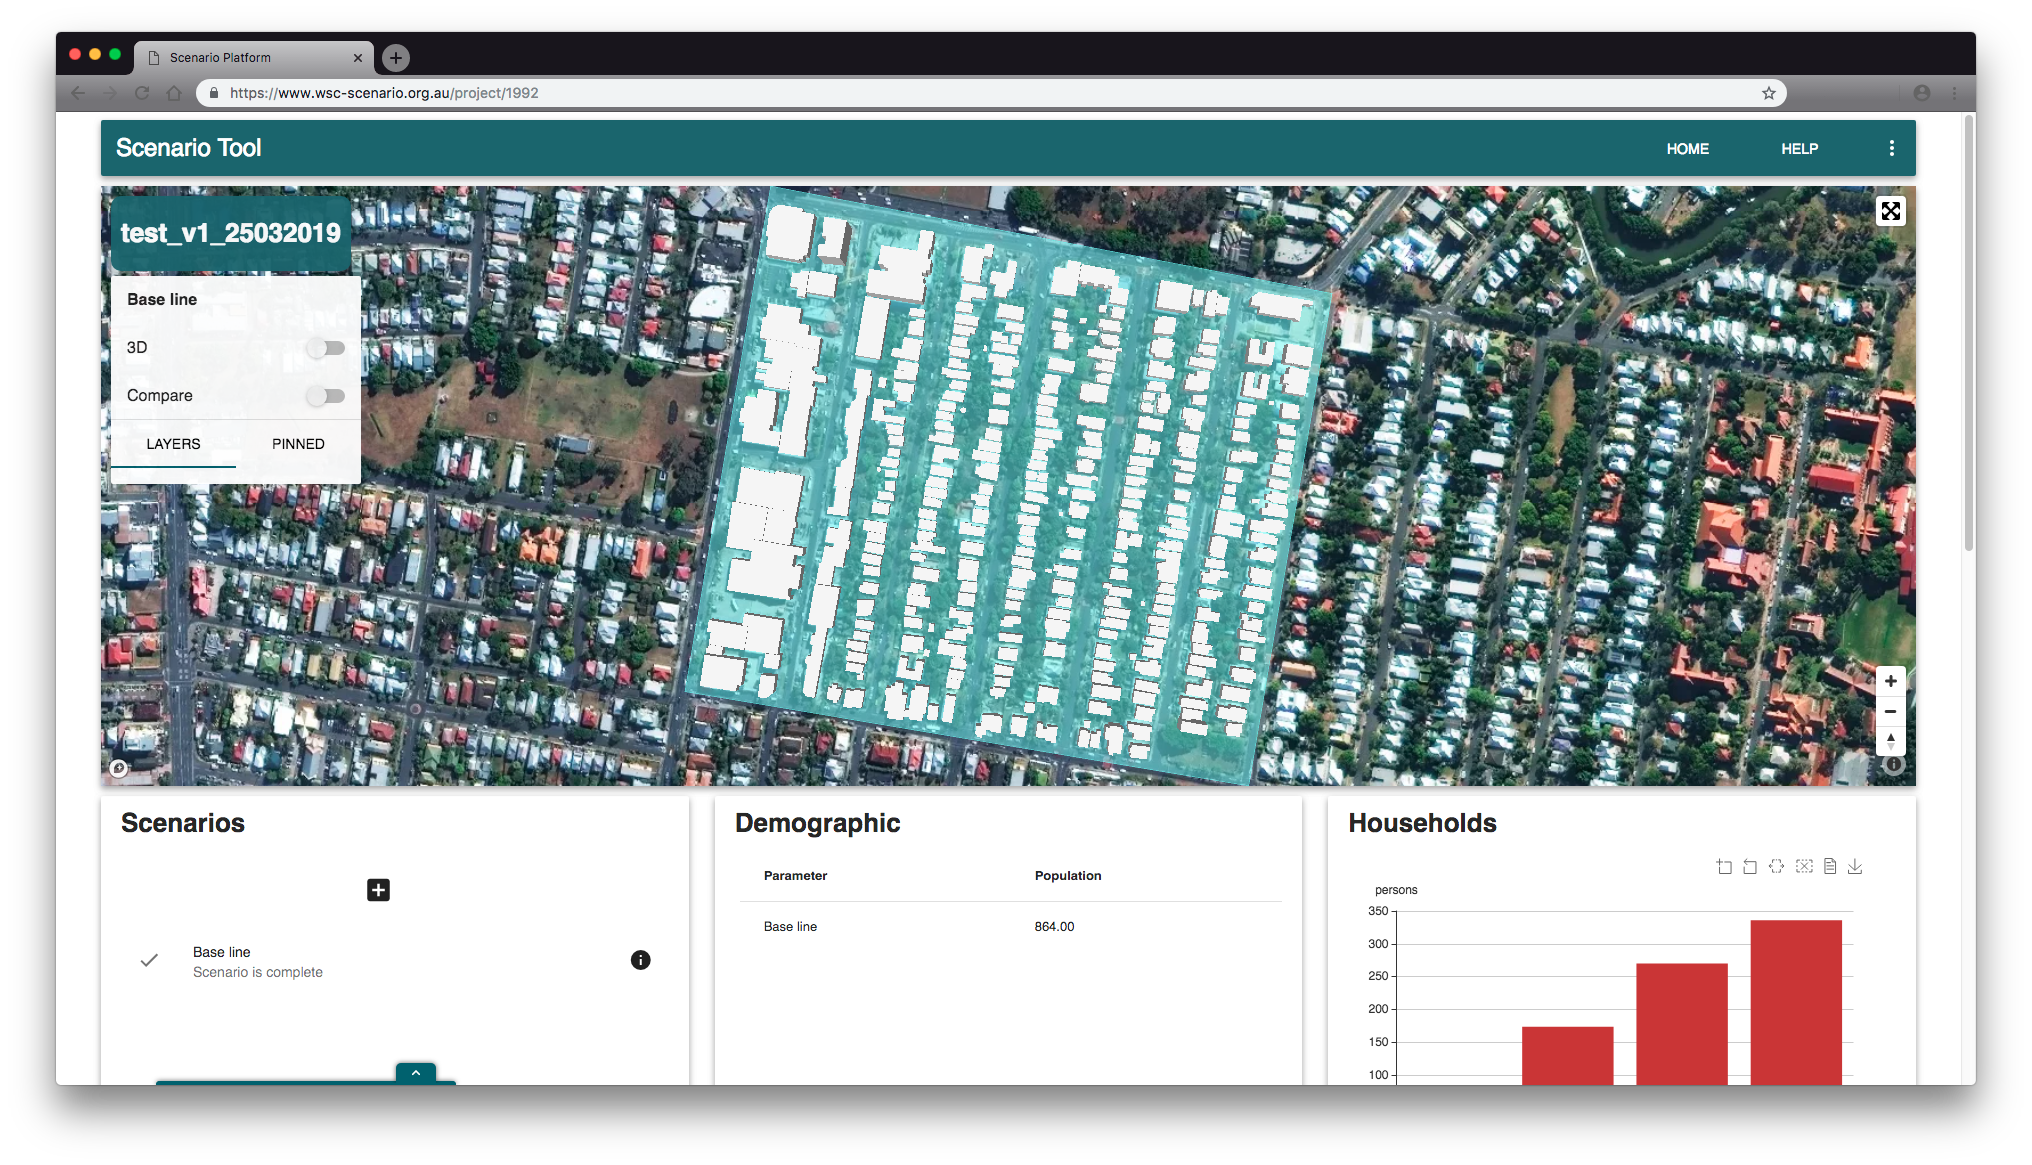
Clicking on the scenario in the ‘Scenario’ pane allows the results to be overlaid spatially on the satellite imagery – select the various layers that appear under the ‘Layers’ dropdown menu, and then toggle how they are displayed using the menu options in the legend that subsequently appears on the map.
To set up an alternate strategy, click on the addition button within the ‘Scenario’ tile. Name the scenario, and then click ‘Add’. You will be taken to the scenario editor screen.
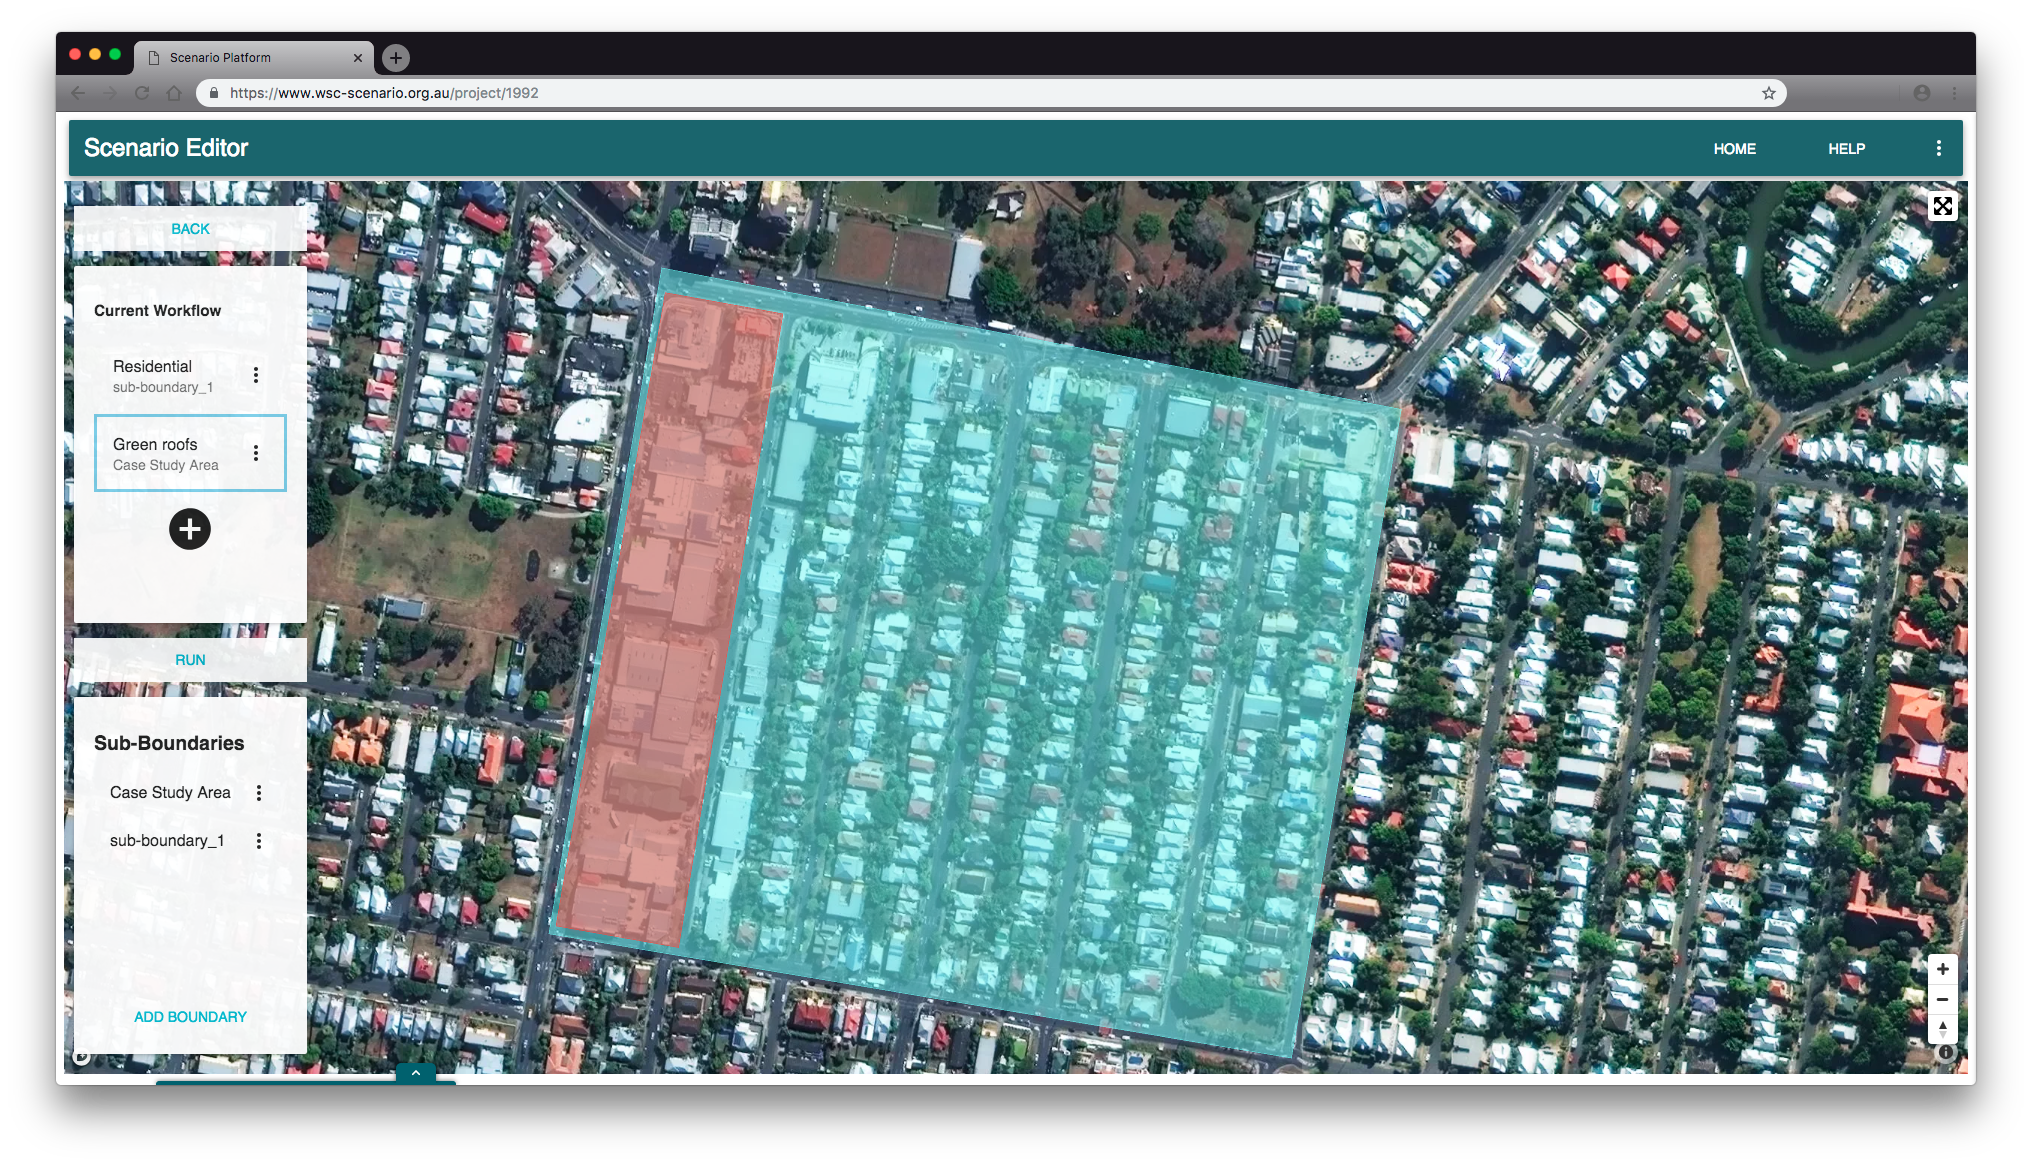
Use the ‘Sub-Boundaries’ pane to create regions to modify, and then use the ‘Current Workflow’ pane to specify which change will take place within those areas:
Adding sub-boundaries will involved either (1) importing a map file with a boundary or (2) drawing an area, within which urban form or water management will be subject to change.
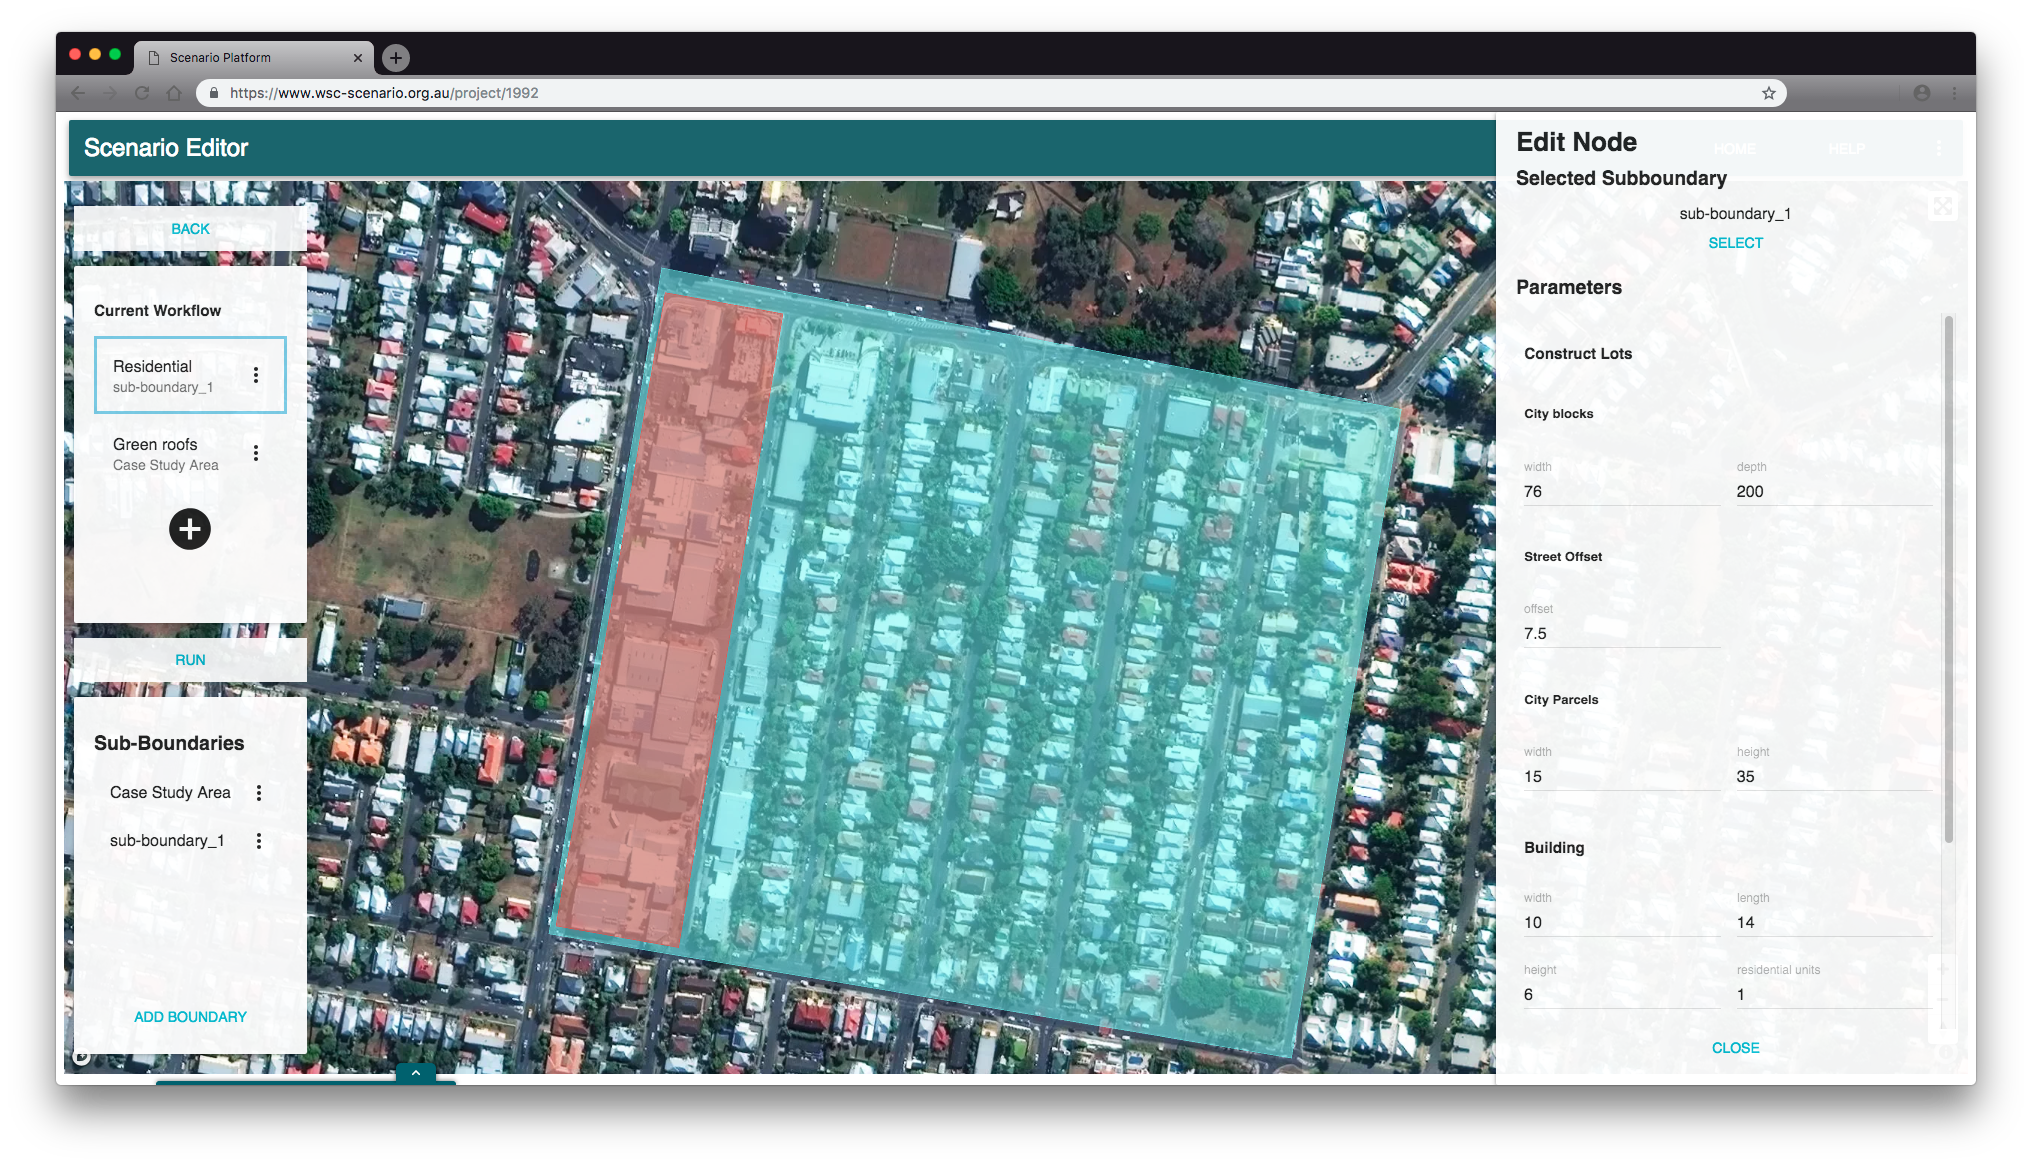
Setting up the scenario will involve adding nodes to the workflow, each of which perform different actions and will relate to an area created within the ‘Sub-Boundary’ pane (only the residential, green roof and wetland nodes are available to demo users).
Each node will have its own set of adjustable parameters, and these can be changed when the node is first selected, or when it is highlighted in the ‘Current Workflow” pane.
After your scenario has been prepared, click on the ‘Run’ button. You will be taken back to the main dashboard.
Simulations will be executed until the modelling for the scenario is finished. At this point, the text underneath the name of the scenario will read ‘Scenario is complete’. Congratulations, you have run your first scenario! Feel free to create additional alternate strategies using different sub-areas and workflow nodes, or peruse the results through the dashboard tiles and map layers.