Training Seminar 10 - Developing cooling strategies
Session Information
Case Study Site: Truganina in Melbourne, VIC
Recorded on Wednesday 12 August 2020 | 1pm AEST
Instructions
The Truganina precinct has been adopted as part of the focus area for a recent Scenario Tool case study. The purpose of this case study is to consider how specific interventions of urban form and green infrastructure in greenfield development areas can support the delivery of better urban heat outcomes. There is keen interest amongst government stakeholders to investigate how strategic changes to urban planning and development may help to reduce the exposure to extreme heat conditions.
The Truganina PSP describes the vision for Truganina and ensures the delivery of key local infrastructure to promote accessibility and community activity within the precinct. In this tutorial, we will use part of the Truganina PSP with the Scenario Tool to model air temperature for a specified area of mixed land uses and quantify the potential impact or alternative planning scenarios. In total, four scenarios will be produced: the baseline conditions detailing the current state of pre-developed Truganina, a business-as-usual case reflecting the proposed development of Truganina owing to existing planning policies and schemes, and three intervention scenarios that each feature different alternative water source systems.
Truganina - Urban Heat Model
Model Setup
Before beginning, use this Dropbox folder to access the GIS data employed as part of this seminar
To start, navigate to the Scenario Tool website and log in using your registration details (otherwise register for the tool and then proceed to log in)
At the project dashboard, create a new project, name it, and set the region to Melbourne
Select the Land Surface Temperature and TARGET Urban Heat Island assessment
Upload the boundary file that is part of the GIS dataset previously referred to
Submit the project to initialisation it
Upload the remaining GIS files after reaching the project dashboard
Scenario 1 - BAU
This scenario represents the business-as-usual approach. Model file
Note
The nodes, their parameters and the GIS layers used with them have been informed from a combination of relevant literature and government authority input. As part of this seminar, the specific documentation for each node should be read to gain an understanding of its function and the resources used to calibrate it.
To prepare the business-as-usual scenario, begin with the ‘Clear Area’ node and add ‘Residential’ node, using the ‘residential.geojson’ file as the area of effect and the parameter set below; then, follow the relevant table to set up the rest of the scenario. Fig. 2 shows the outputs for the urban from and land surface temperature accross the case study area
Note
The Urban From node refers currently to the residential node which will be renamed
Parameter |
Residential |
Light Industrial Zone |
Educational Zone |
|---|---|---|---|
Workflow Node |
Residential |
Residential |
Residential |
Area |
Residential |
Industrial |
School |
City block width |
80 |
180 |
10000 |
City block length |
240 |
120 |
10000 |
Street offset |
8 |
5.25 |
0.1 |
Parcel width |
14 |
54.75 |
10000 |
Parcel length |
31 |
42.8 |
10000 |
Building height |
6 |
7.5 |
7.5 |
Site coverage |
0.6 |
0.45 |
0.2 |
Residential units |
1 |
2 |
680 |
Hardstand fraction |
0.5 |
0.82 |
0.63 |
Garden fraction |
0.8 |
0.8 |
1.0 |
Tree canopy diameter |
7 |
7 |
7 |
Percentage of lots with trees |
0 |
0 |
0 |
Number of trees per lot |
0 |
0 |
0 |
Street tree spacing |
28 |
28 |
28 |
Workflow Node |
Assign Fractions |
Assign Fractions |
Assign Fractions |
Area |
Recreational Reserve |
Road |
Other Pervious Area |
Tree Cover |
0 |
0 |
0 |
Water Cover |
0 |
0 |
0 |
Grass Cover |
0 |
0.25 |
0.9 |
Irrigated Grass Cover |
1.0 |
0 |
0 |
Roof Cover |
0 |
0 |
0 |
Road Cover |
0 |
0.5 |
0 |
Concrete Cover |
0 |
0.25 |
0.1 |
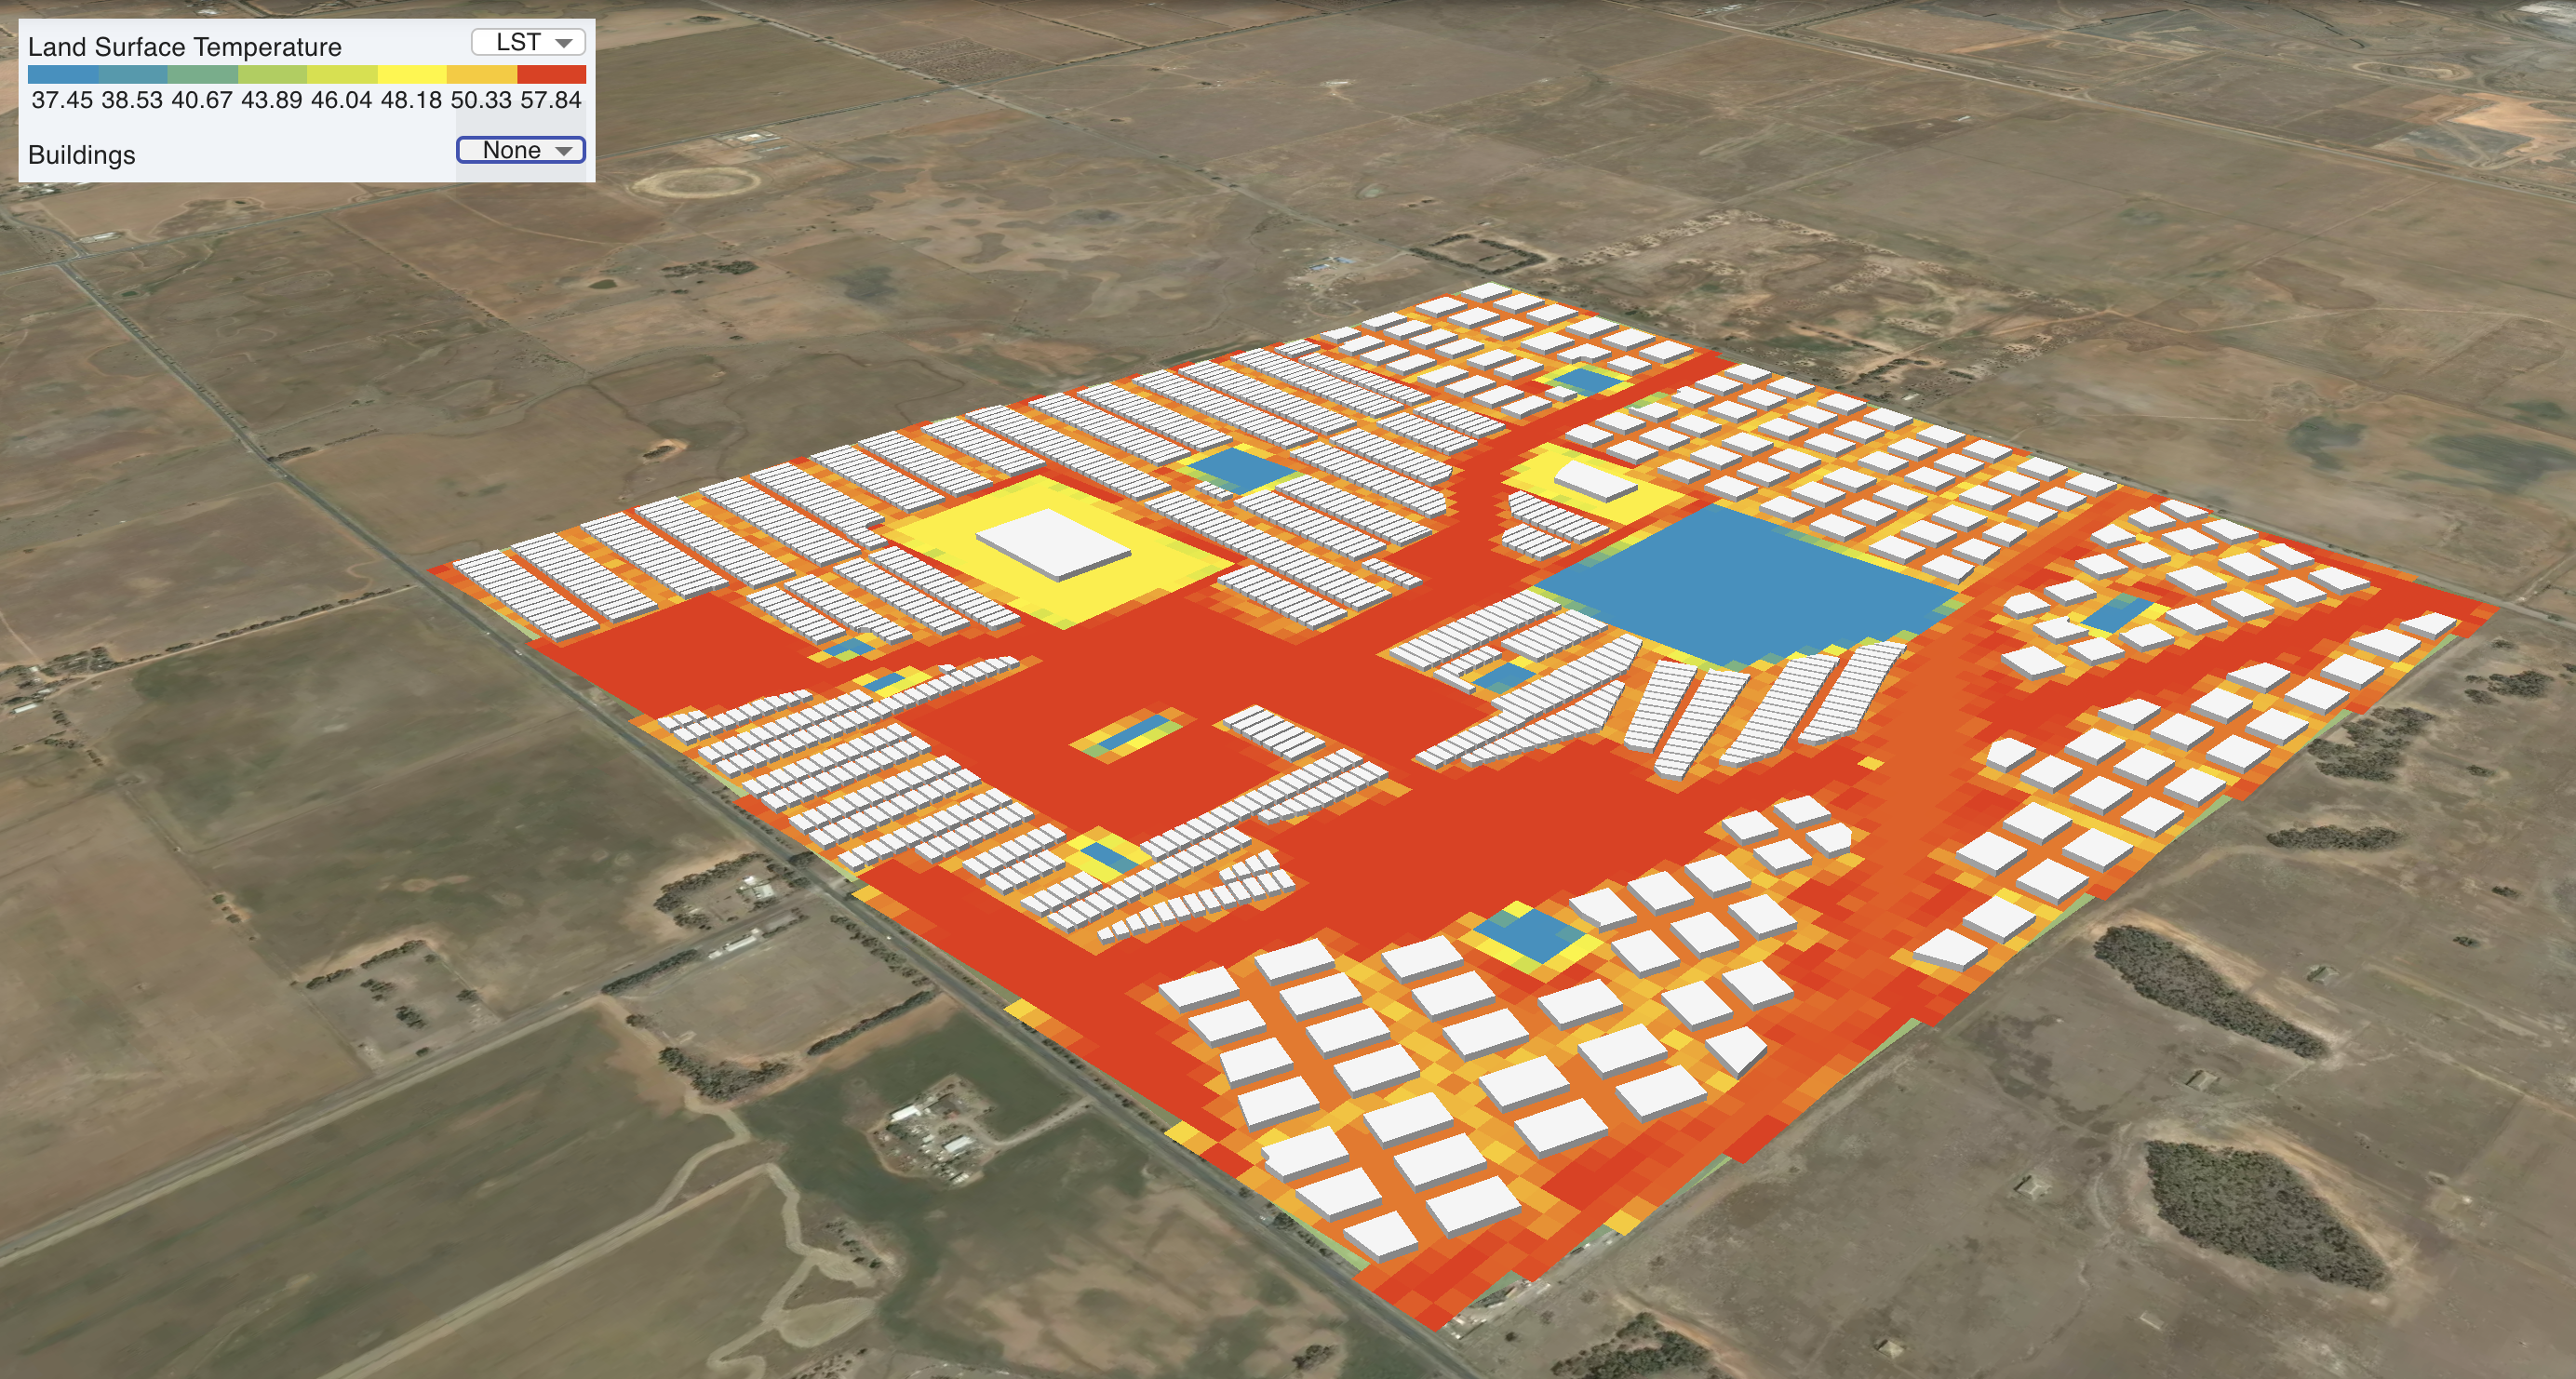
Fig. 2 Urban form and Land Surface Temperature for the BAU scenario
Scenario 2 - Trees
The first intervention scenario is to assess the impact of increased tree canopy. Therefore, for the residential area add 2 trees per lot and reduce the tree spacing to 13m.
Parent scenario: BAU
Parameter |
Residential |
|---|---|
Workflow Node |
Residential |
Area |
Residential |
City block width |
80 |
City block length |
240 |
Street offset |
8 |
Parcel width |
14 |
Parcel length |
31 |
Building height |
6 |
Site coverage |
0.6 |
Residential units |
1 |
Hardstand fraction |
0.5 |
Garden fraction |
0.8 |
Tree canopy diameter |
7 |
Percentage of lots with trees |
100 |
Number of trees per lot |
2 |
Street tree spacing |
13 |
Scenario 3 - Reduced Site Cover
This scenario explores the impact of reduced site cover. Use the same parameters as before but set the site cover to 0.5 and increase the garden fraction to 0.9
Parent scenario: Trees
Parameter |
Residential |
|---|---|
Workflow Node |
Residential |
Area |
Residential |
City block width |
80 |
City block length |
240 |
Street offset |
8 |
Parcel width |
14 |
Parcel length |
31 |
Building height |
6 |
Site coverage |
0.5 |
Residential units |
1 |
Hardstand fraction |
0.4 |
Garden fraction |
1 |
Tree canopy diameter |
7 |
Percentage of lots with trees |
100 |
Number of trees per lot |
2 |
Street tree spacing |
13 |
Scenario 4 - Additional Measures
Try to explore additional measures eg. reduction of road surfaces or green roofs.