Training Seminar 5 - City of Kingston
Session Information
Case Study Site: City of Kingston, Victoria
Recorded on Thursday 12 December 2019 | 2:30pm ADST
Instructions
As part of its functionality, the Scenario Tool models the performance of different urban form scenarios through the lens of the urban heat island effect – residential subdivision, or more broadly infill development, falls within this scope. The tool has multiple ways of simulating infill development, with units, townhouses and apartments all being able to be characterised by the model. The rate at which these housing typologies are generated is a factor of a region’s population projections and planning regulations. In this seminar, we distribute new households into different land use zones on the basis of future infill development, producing a change in the residential urban form and allowing us to quantify the impact this has on urban heat metrics.
The seminar will use 2 models to explore current and future impacts of urban heat in the City of Kingston.
Assessment of the today’s urban heat exposure to identify hot spots
Assessment of the impacts of urban development in a sub catchment of the City of Kingston
Note: none of the data or modelling specifications included within this training exercise are reflective of any real-world initiatives undertaken by the City of Kingston local government authority or any other organisation.
Preparation
Before beginning, use the link to this Dropbox folder to access the GIS files employed as part of this case study and download them to your computer.
To start, navigate to https://staging.wsc-scenario.org.au/ and click on ‘Register’ if you haven’t done so yet (note: you’ll have to re-register for the tool here if you had previously registered for an older iteration of the tool).
Log in using your registration details. You will be taken to the project dashboard – hit the plus button to bring up the new project setup window. Enter a name for your project, and select Melbourne from the dropdown menu for your region. Then click ‘Next’.
Heat Exposure in the City of Kingston
Model Setup
Create a new project and select the Melbourne Region
- Select the assessment models in following order
Land Surface Temperature
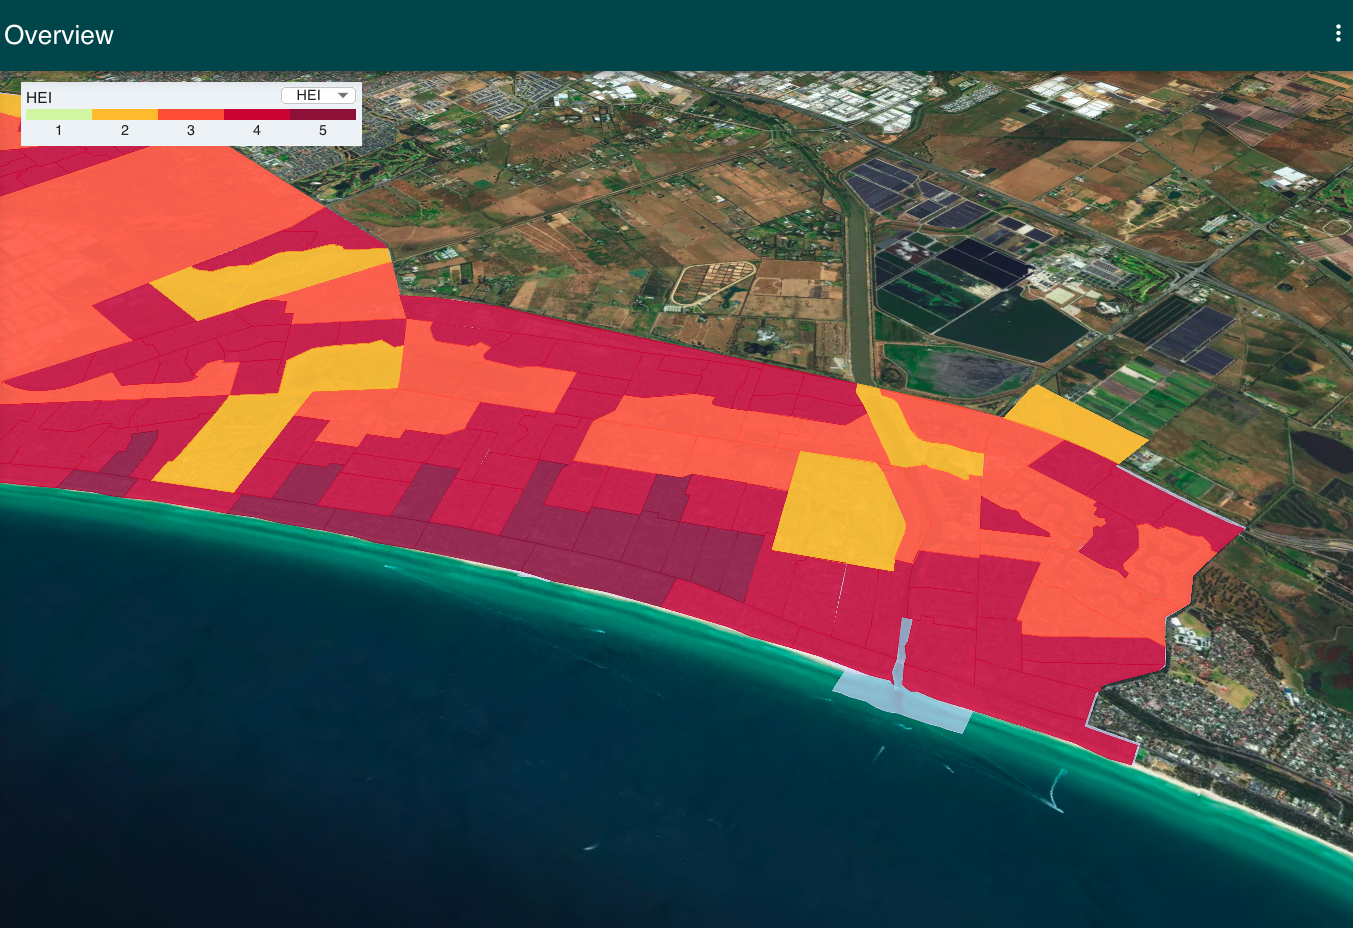
Heat Exposure Index
Upload the City of Kingston boundary provided in the data pack
Confirm and submit the simulation
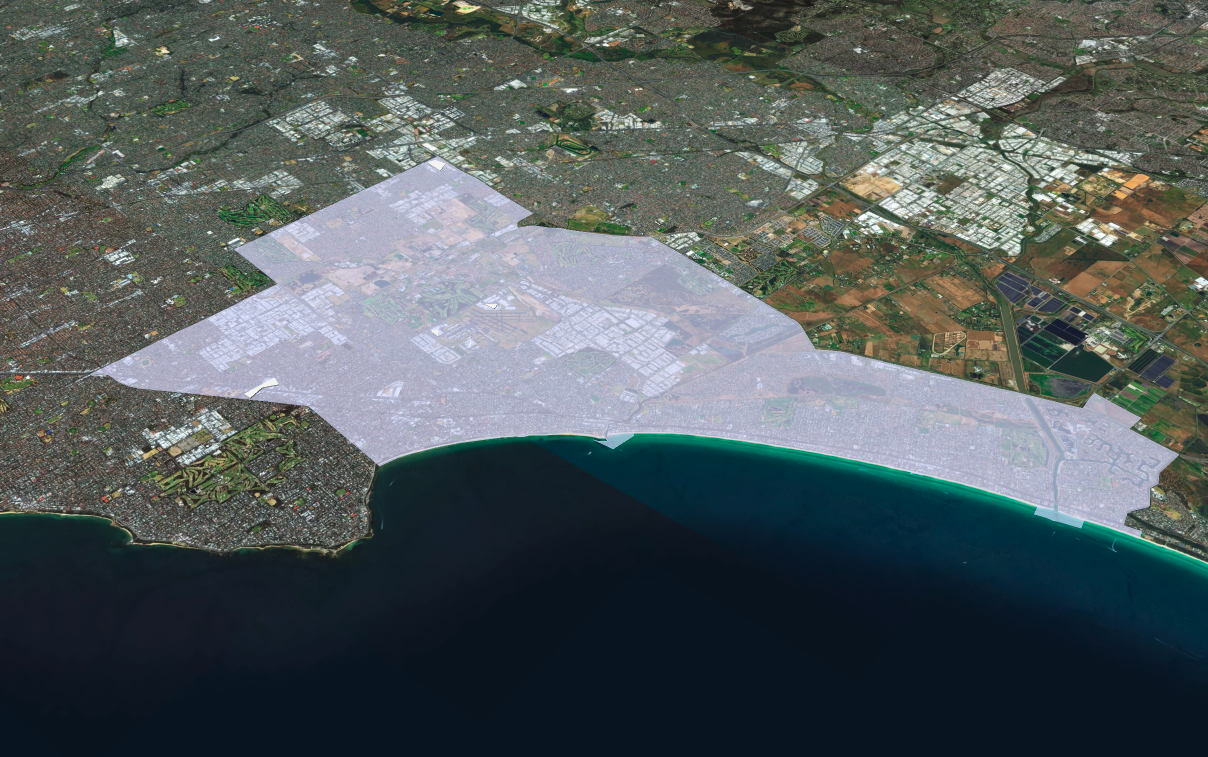
Note we are simulating all of the City of Kingston’s area so the simulation will take some time to initialise (up to 20min)
Viewing the Results
After the model has been initialised the results for tree cover, land surface temperature, the exposure index and expose population can be explored. Try to use the dashboard and the map to identify heat hot spot’s in the City of Kingston and relation ship between tree cover and land surface temperature.
Heat Exposure in the City of Kingston 2051
Model Setup
Create a new project and select Melbourne Region
- Select the assessments models in following order
Land Surface Temperature
Heat Exposure Index
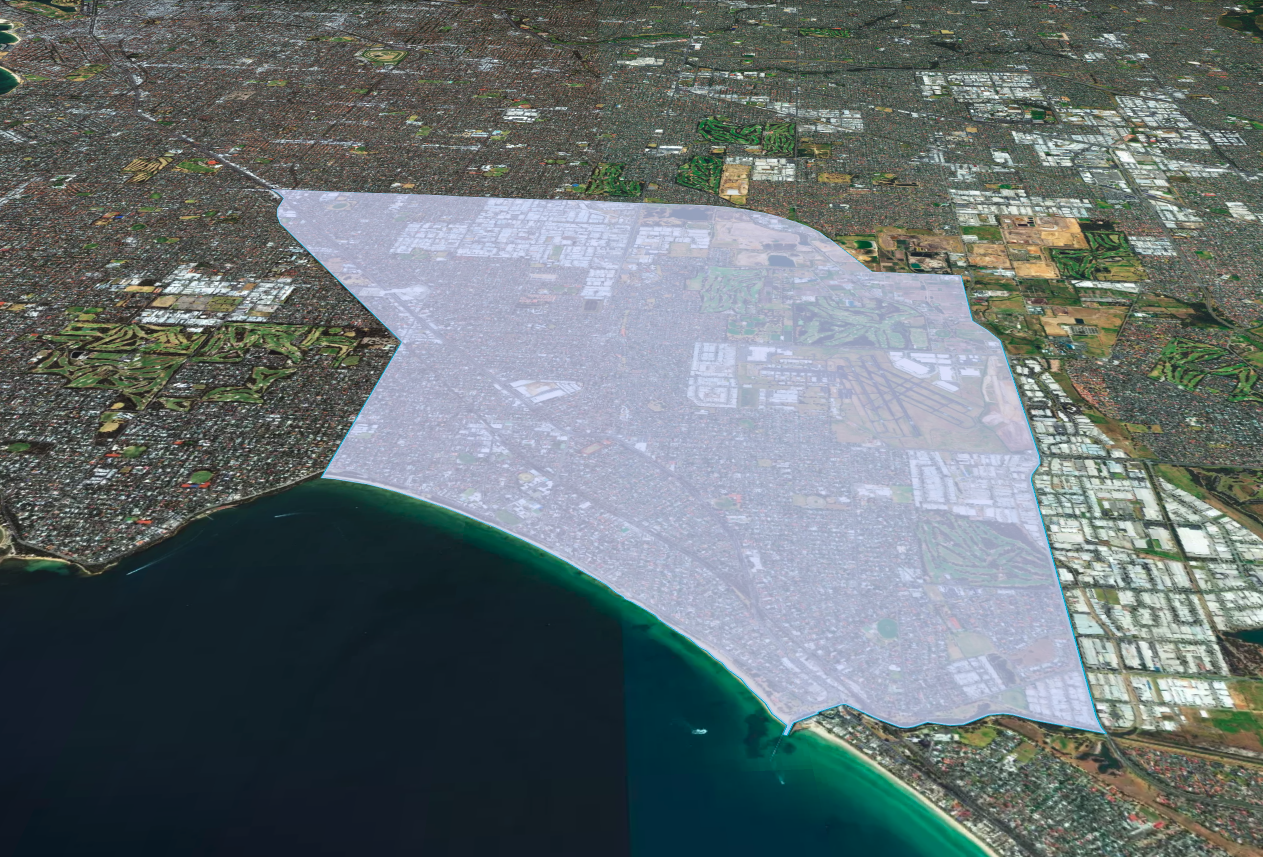
Upload the case study small boundary provided in the data pack for this seminar
Confirm and submit the simulation
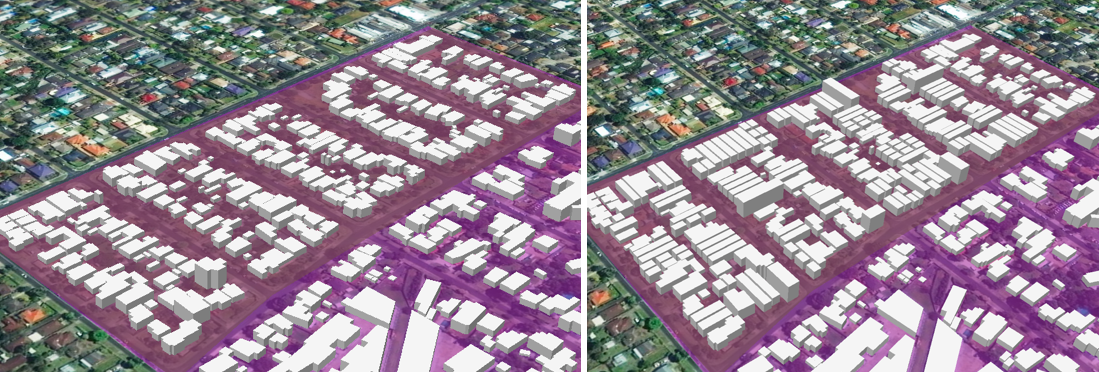
Setting Up a Scenario
For this seminar we will an increase of the population by 17.500 or 7000 households. This will almost double the current population.
The population will be distributed in the GRZ simulating typical development patterns for Melbourne. (see below)
Development Type |
Additional Households |
Side by Side |
3000 |
Townhouse |
2000 |
Apartment |
2000 |
We will explore 2 scenario
A BAU scenario with no tree per redeveloped lot
A MAINTAIN scenario wit one additional tree per development
First, upload the GRZ zoning provided in the data pack.
Next, create a new BAU scenario and add the following nodes. You can find the nodes under the Urban From tab.
Side by Side
Townhouse
Apartment
Set the parameters for additional households to the above values and set the number of trees to 0 to simulate a BAU scenario.
Repeat the process for the MAINTAIN scenario but set the number of trees per lot parameter to 1.
Viewing the Results
After the scenarios have been executed explore the impacts of the 2 different scenarios on the tree cover, land surface temperature, the exposure index. Try to use the dashboard and the map to identify heat hot spot’s and relation ship between tree cover and land surface temperature.