Training Seminar 1 - East Adelaide Case Study
Session Information
Case Study Site: Salisbury East, SA
Recorded on Wednesday 1 May 2019 | 3pm AEST
Instructions
Site Background: Salisbury East Precinct is a low density residential area with scattered underused and vacant lots in residential and industrial zones. The important thing for City of Salisbury officers is that future developments must meet residents’ expectations while also implementing water sensitive solutions. In particular, the City of Salisbury wants designs that improve liveability and connectivity, and ensure attractive urban renewal of the whole precinct. We will develop a business as usual and water sensitive city scenario based on the Tools & Products team experience in Adelaide.
Designing the Scenario
We will evaluate 3 scenarios in Adelaide, with the first being the baseline run of the case study area. Each scenario will add a new type of development based on the users’ input informed by potential policy change. They are listed below:
Create a new project, and select module: Land Surface Temperature
You will create 2 scenarios in addition to the baseline
Scenario 1: Baseline (upload the boundary file)
Scenario 2: Business as Usual (upload the BAU files)
Scenario 3: Water Sensitive City (upload the WSC, park, and road files)
Files to be used can be access from Google Drive Folder (or email us for the files) https://drive.google.com/open?id=1XroksWWtnoCV6P1jGYqni3SmQ41H7OOd
The team has translated policy documents to digital parameters based on inputs from local authority and experts. Users should read the documentation on each node to understand its effect and application (by accessing ‘Help’). Access to policy or existing documents can come from a range of sources, and for this case study we retrieved files from the departments responsible for planning, transport, and redevelopment in Southern Australia.
Scenario 2: Business as usual (BAU) Parameter
Order of Workflow |
1 |
2 |
Adaptation Node |
Subdivision |
Subdivision |
Infrastructure Area |
Redevelopment BAU_R12 |
Redevelopment BAU_R13 |
Parameters |
Infill fraction: 1 Parcel depth: 26 Length: 29 Width: 17 Residential units: 1 Hardstand proportion: 0.59 Tree cover proportion: 0.07 Irrigation proportion: 0.3 Percentage of lots with trees: 100 Number of trees per lot: 1 Tree canopy diameter: 5.8 |
Infill fraction: 1 Parcel depth: 14 Length: 16 Width: 10 Residential units: 1 Hardstand proportion: 0.59 Tree cover proportion: 0.07 Irrigation proportion: 0.3 Percentage of lots with trees: 100 Number of trees per lot: 1 Tree canopy diameter: 5.8 |
Intended output |
Housing for density of 20 dwellings per ha |
Housing for density of 60 dwellings per ha |
Scenario 3: Water Sensitive City (WSC) Parameter
Order of Workflow |
1 |
2 |
3 |
4 |
Adaptation Node |
Subdivision |
Subdivision |
Open Space Irrigation |
Create Roadway |
Infrastructure Area |
Redevelopment WSC_R10 |
Redevelopment WSC_R14 |
Dry Grass Cover |
Roadway |
Parameters |
Infill fraction: 1 Parcel depth: 14 Length: 14 Width: 9 Residential units: 1 Hardstand proportion: 0.16 Tree cover proportion: 0.22 Irrigation proportion: 0.47 Percentage of lots with trees: 100 Number of trees per lot: 2 Tree canopy diameter: 8.1 |
Infill fraction: 1 Parcel depth: 18 Length: 18 Width: 11 Residential units: 1 Hardstand proportion: 0.16 Tree cover proportion: 0.22 Irrigation proportion: 0.47 Percentage of lots with trees: 100 Number of trees per lot: 2 Tree canopy diameter: 8.1 |
Percentage of irrigated grass: 100% |
Grass proportion: 0 Irrigated grass proportion: 0 Road proportion: 0.69 Concrete proportion: 0.31 Tree spacing: 12.8 Tree canopy diameter: 12.9 |
Intended output |
Housing for density of 80 dwellings per ha |
Housing for density of 50 dwellings per ha |
Irrigation for all public parks |
Increase street tree coverage across public roadways |
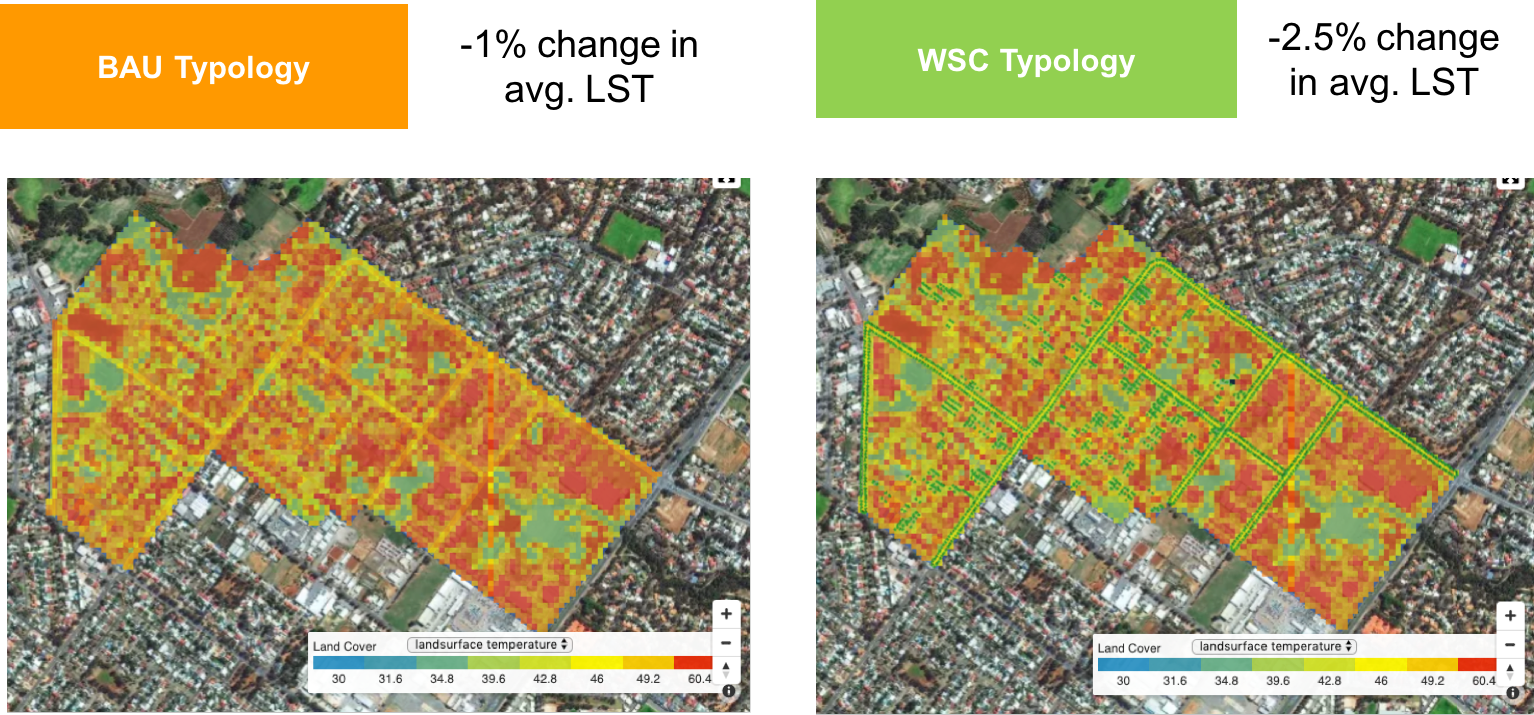
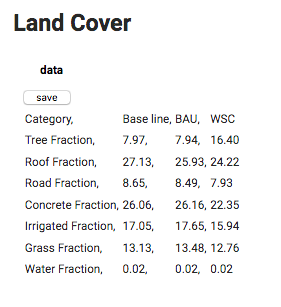
Results
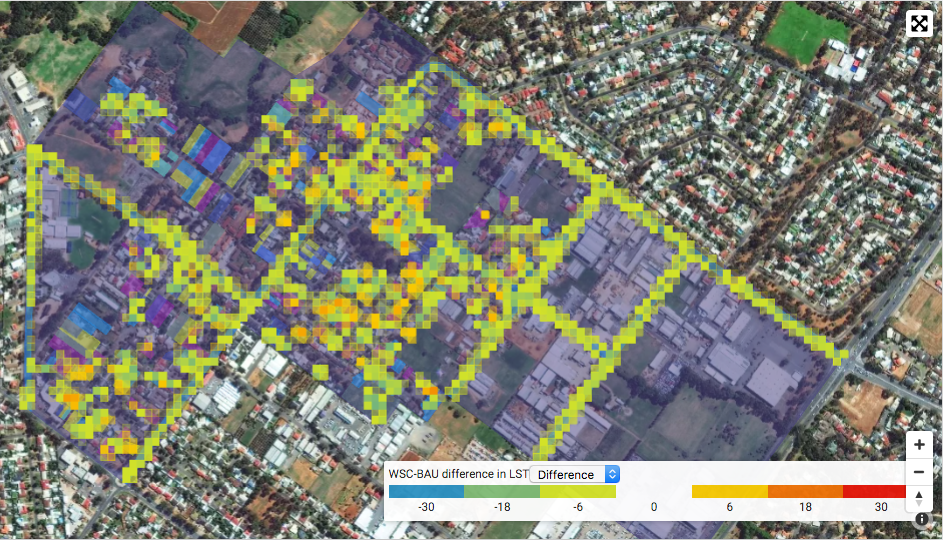
Your scenario results should reflect similar visual interpretations, and same land cover results.
A new comparison feature has been developed for users to better visually assess the difference between 2 scenarios modelled outputs. To learn more about how to do the below, watch the video above!