TARGET
Background
TARGET (The Air-temperature Response to Green/blue infrastructure Evaluation Tool), constituting the Urban Heat Island module of the Scenario Tool, is a model that generates time series of land surface and air temperatures using a more simplified set of modelling algorithms (in comparison to traditional UHI modelling) in order to optimise simulation speed. It does so harnessing inputs of land cover information and meteorological data specific to the region of interest (which is intended to exist at the street-to-precinct scale) at the half-hourly times steps at which it runs. The model was developed jointly by researchers at Arizona State University, Monash University and Ghent University, to address the need for a computationally-efficient method of assessing the microclimate impacts of green infrastructure in the urban setting.
Use Cases
TARGET can be used to examine the temporal and spatial variance of land surface and air temperatures over a three-day heatwave. Specific use cases have included: exploring the urban heat island effects of different urban development scenarios for a newly designated precinct area; visualising the cooling provided by the planting of a series of new trees along a town centre street; and demonstrating the before-and-after effects of a range of WSUD interventions on the microclimate of a suburban recreational reserve.
Methodology
The land cover data that TARGET uses to run its simulations is derived from the ‘microclimate grid’ that is generated for any given case study area – the microclimate grid assigns land cover fractions to each of the cells that comprise it (for a full rundown of the concept of the microclimate grid, refer to the Methodology section of the Land Surface Temperature guide). A script is run that translates the cell’s fractions into a CSV file that is able to be read by the model’s code-based architecture (note that modelled values are calculated discretely for each grid cell, and that there is no interaction between a grid cell and any other – i.e. the individual composition and modelling outcomes of the grid cells bare no influence over each other).
The aformentioned script also calculates a building height-to-street width ratio for every grid cell based on the land cover fractions, as this is another variable required for TARGET modelling and is something that has been assumed by the model developers as being easier to approximate via formulae than to source from real-world observations. The rules for establishing the ratio for the cells are as follows:
If the roof fraction is greater than 0.3, the ratio is equal to 1
If the roof fraction is not greater than 0.3, and if the sum of the dry grass and irrigated grass fractions is greater than 0.5, the ratio is equal to 0.3
If neither the roof fraction is greater than 0.3 or the sum of the dry grass and irrigated grass fractions is greater than 0.5, then the ratio is equal to 0.5
The other CSV file TARGET relies on, which contains climate data, is also modified to reflect site-particular meteorological conditions. This alteration first stems from the determining of the hottest three-day period (by way of mean maximum temperature) recorded by the most relevant (i.e. closest) weather station to the study area (this is done by calculating a three-point moving average with the Bureau of Meteorology maximum daily temperature data). Dry bulb air temperature, mean sea level pressure, wind speed, shortwave radiation and longwave radiation can then be replicated from the BOM data sources into the CSV file using the three days identified.. The relative humidity, which is also required as a part of the input climate data, is computed from the Magnus formula and the Arden Buck equation using dew point temperatures and the dry bulb air temperatures; additionally, shortwave radiation and longwave radiation are cloned into the meteorological file from a monthly BOM one-second time series, so every 30th entry during the heatwave period must be cited for replication.
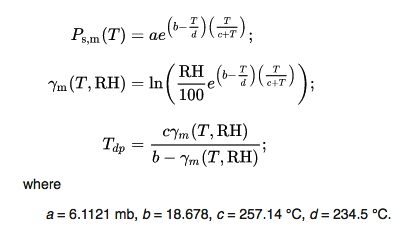
Fig. 14 Figure 1. The relative hudimity is back-calculated from the Magnus formula, which incorporates the Arden Buck equation for greater accuracy.
With the land cover and meteorological input updated for the user-defined catchment area, the code comprising TARGET is now run. The actual sets of algorithms that TARGET consists of include: a radiation balance, a LUMPS surface energy balance, a force-restore model, and a simple water body model.

Fig. 15 Figure 2. TARGET modelling processes and methodology.
The workflow of TARGET’s variables through its sub-models is described in the steps below:
The radiation balance determines the net radiation available for calculations as part of the LUMPS surface energy balance, using incoming shortwave and longwave radiation inputs
The sensible, latent and storage heat fluxes are established from the LUMPS surface energy balance
Storage heat fluxes are employed within the force-restore model to calculate changes in surface temperatures
Incoming shortwave radiation, relative humidity and air pressure data is used in the simple water body model as part of its computation of surface water temperature alterations
Surface temperature changes are used in combination with wind speed and building height-to-street width ratios to determine street level and above-street level air temperatures
For a more detailed description of TARGET’s modelling methodology and its algorithms, see Broadbent et al. (2018).
Output
The output of the model’s operation is a data array that correlates to the microclimate grid used to engender the TARGET land cover input. The array contains air and land surface temperatures for each half-hourly timestep within the three-day modelling period, for every grid cell. The data that it contains is used to display a graph of average air temperature over the 72-hour heatwave that has been simulated; a table of standalone mean values that average the highest air temperature observations recorded for each cell of the catchment during the duration of the modelling; and a gridded map denoting the spatial variation of the average air temperature through the application of a colour gradient, where the cooler areas are shaded lighter and the warmer areas shaded darker. The gridded map can also be amended to depict variations in air temperature between different scenarios (note: results will not be produced for grid cells possessing a roof fraction of 0.8 or more as TARGET assumes there is no physical canopy area to model air temperature for).
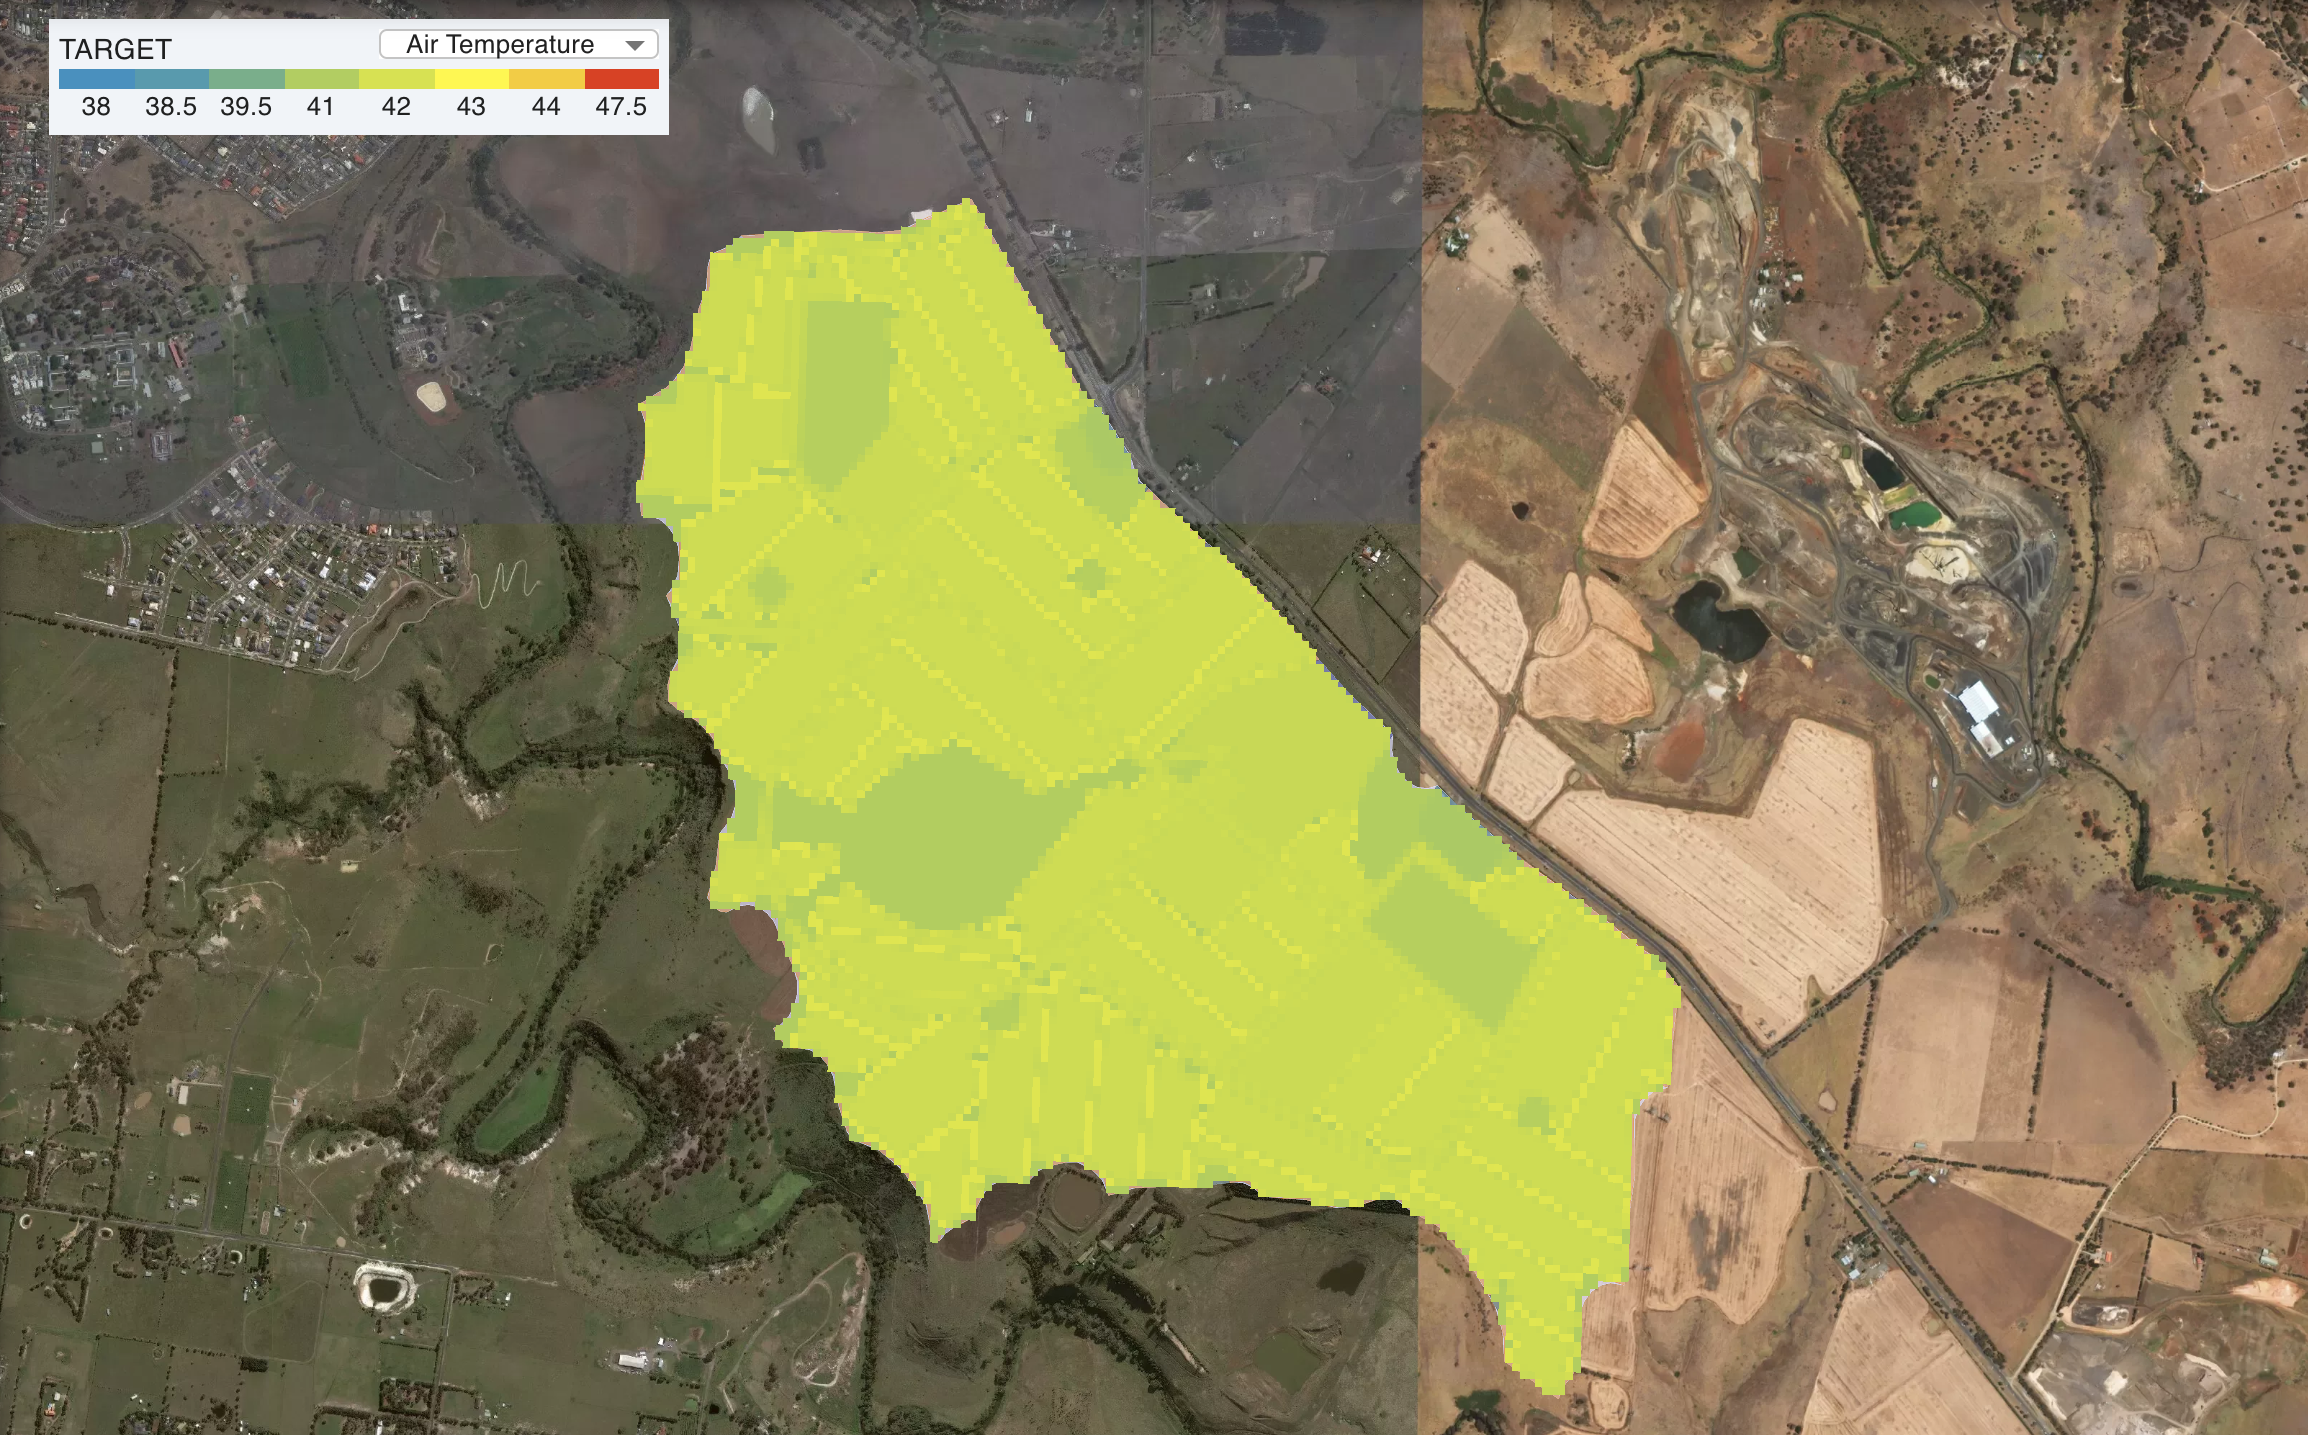
Fig. 16 Figure 3. Graduated air temperature map produced via TARGET modelling.